
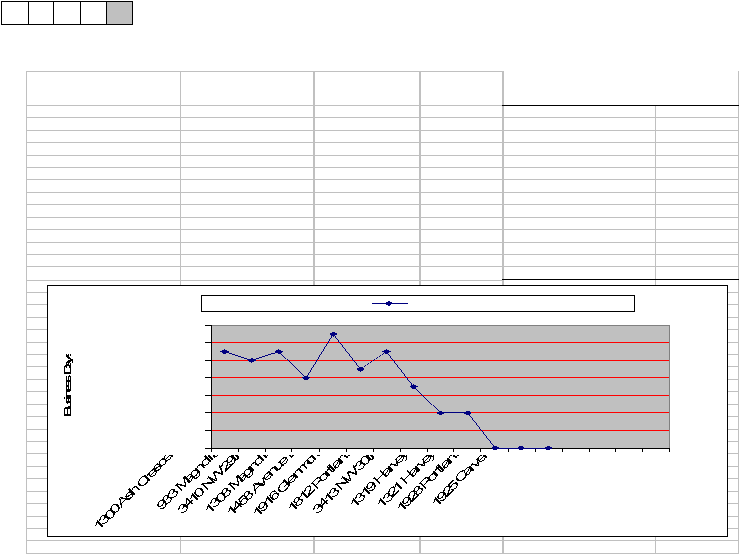
HFH Control Chart –
Total cycle time
D
M
A
I
C
Address
Date inspector
finaled
Electric
start date
Total
cycle
time
1300 Ash Crescent
1/6/2003
1/20/2003
11
Mean
8.8
933 Magnolia
1/6/2003
1/17/2003
10
Standard Error
0.963789
3410 NW 29th
1/23/2003
2/6/2003
11
Median
9.5
1308 Magnolia
2/6/2003
2/17/2003
8
Mode
11
1458 Avenue E
2/27/2003
3/17/2003
13
Standard Deviation
3.047768
1916 Glenmore
3/31/2003
4/10/2003
9
Sample Variance
9.288889
1812 Portland
4/2/2003
4/16/2003
11
Kurtosis
-0.65605
3413 NW 30th
5/1/2003
5/9/2003
7
Skewness
-0.58753
1319 Harvey
5/12/2003
5/15/2003
4
Range
9
1321 Harvey
5/12/2003
5/15/2003
4
Minimum
4
1928 Portland
5/16/2003
Maximum
13
1925 Carver
Sum
88
Count
10
Confidence Level(95
2.180243
IMR Descriptive Statistics
11
10
11
8
13
9
11
7
4
4
0
0
0
0
2
4
6
8
10
12
14
Address
Series1