< > Six Sigma Project Example for Nonprofit Organizations - page 16 of 36 www.6sigma.us - www.6sigma.us/six-sigma-training.php - https://www.6sigma.us/six-sigma-online-training.php
Navigation bar
  Six Sigma Home Start Previous page
 16 of 36 
Next page End Contents 11 12 13 14 15 16 17 18 19 20 21  

Probability
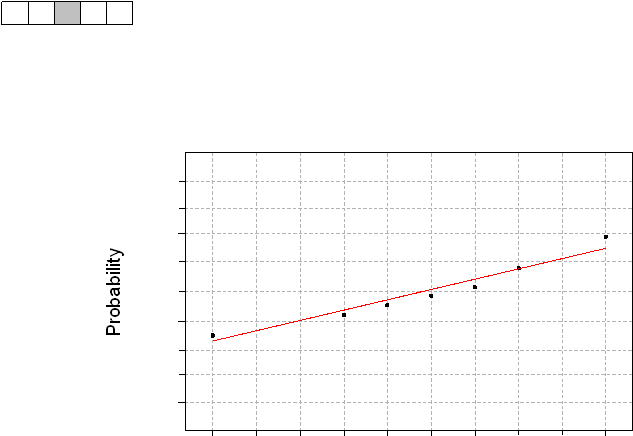
2003 Total Cycle Time normality chart
Average: 8.8
StDev: 3.04777
N: 10
Anderson-Darling Normality Test
A-Squared: 0.401
P-Value:   0.292
4
5
6
7
8
9
10
11
12
13
.001
.01
.05
.20
.50
.80
.95
.99
.999
Total Cycle
2003 Total Business Day Cycle Time
D
M
A
I
C