

Statistical Design of Experiments
Statistical Design of Experiments
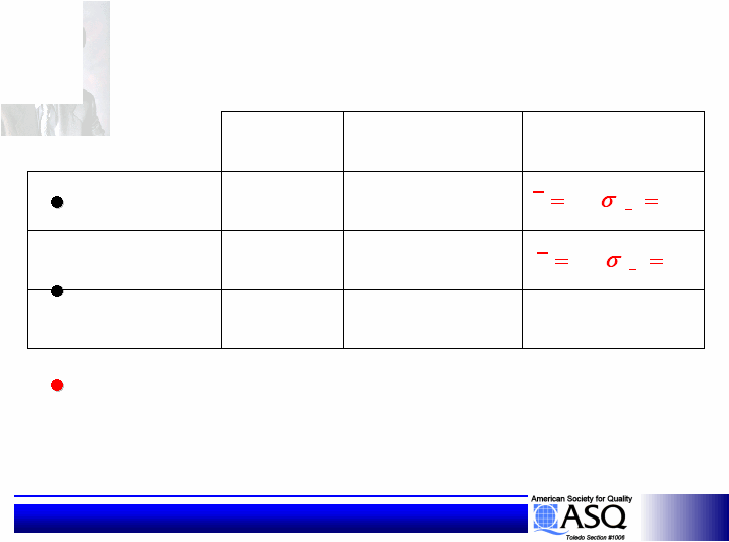
Confirmation Run
Confirmation Run
Conduct conformation runs for the initial
Conduct conformation runs for the initial
and the optimum designs
and the optimum designs
Calculate the S/N ratios for both designs,
Calculate the S/N ratios for both designs,
and compare to the predicted S/N ratios:
and compare to the predicted S/N ratios:
S/N
Prediction
Confirmation
Variable Data
Initial Design
16.1 dB
Optimum
Design
31.4 dB
Gain
15.3 dB
Once the S/N ratio is confirmed (variability
Once the S/N ratio is confirmed (variability
reduction confirmed), observe the mean of
reduction confirmed), observe the mean of
the confirmation run, then adjust it to target.
the confirmation run, then adjust it to target.
20.1 dB
20.1 dB
31.9 dB
31.9 dB
11.8 dB
11.8 dB
5
.
7
,
76
1
n
y
2
.
2
,
87
1
n
y