

Statistical Design of Experiments
Statistical Design of Experiments
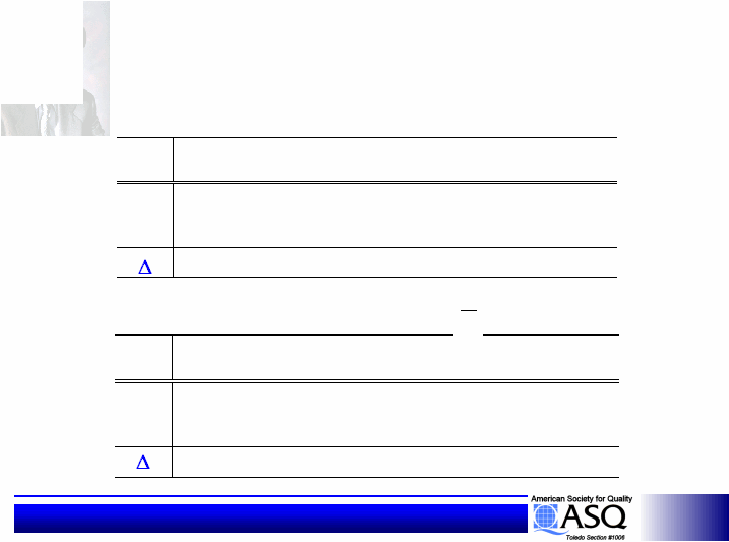
Response Tables
Response Tables
A
B
C
D
E
F
G
H
1
21.7
20.4
23.3
19.7
21.2
21.6
2
20.8
21.9
20.7
19.8
21.6
21.4
3
20.6
20.8
19.1
23.6
20.3
20.1
1.1
1.5
4.2
3.9
1.3
1.5
* in (dB)
Factor
Response Table (S/N)*
Level
Response Table
Level
Factor
A
B
C
D
E
F
G
H
1
66.9
70.3
73.3
73.0
70.2
74.8
2
72.8
69.6
73.1
69.2
69.6
71.8
3
69.6
63.0
67.3
69.6
62.9
5.9
0.7
4.2
5.7
0.6
11.9
y