fbpx

Articles

Image: Standard Deviation of Sampling Distribution

The Definitive Guide to Standard Deviation of Sampling Distribution

You’re a researcher charged with making critical decisions that could impact millions of lives, but you’re blindfolded, left to stumble in the dark. Sound daunting? That’s exactly the predicament you face without a firm grasp of sampling distributions and their standard deviations. These fundamental statistical concepts illuminate the path, transforming educated guesses into accurate inferences […]

View More

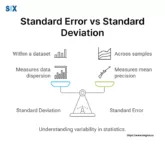
Image: Standard Error vs Standard Deviation

Understanding the Difference: Standard Error vs. Standard Deviation

In the world of statistics, two terms often cause confusion and debate among researchers, data analysts, and students alike: standard error and standard deviation. While they may sound similar, these statistical measures play distinct roles in data analysis and interpretation. Understanding the difference between a standard error vs standard deviation is not just an academic […]

View More

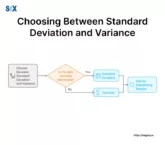
Image: Choosing between Standard Deviation vs Variance

Standard Deviation vs Variance. A Complete Guide for Data Analysis Professionals

Standard Deviation and Variance are crucial in comprehensive data analysis. It helps achieve actionable data that can further be used to optimize manufacturing processes, assess financial risk, or improve customer satisfaction. The insights gained from properly utilizing standard deviation and variance prove invaluable. By the end, you’ll be able to What is Standard Deviation and […]

View More

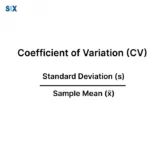
Image: Coefficient of Variation

Coefficient of Variation: Mastering Relative Variability in Statistics

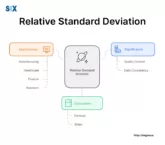
Grasping and utilizing the coefficient of variation (CV) is hugely important for stats analysis and workflow refinement. The CV, also called relative standard deviation, is a scale-free stats metric that quantifies how data scatters around the average. It provides a standardized way to compare variability between data sets, even when the raw units or scales […]

View More

Featured image: What is Pooled Standard Deviation? How to Calculate It

What is Pooled Standard Deviation? How to Calculate It

The pooled standard deviation is an important statistical measure used to summarize and describe the amount of variability in a dataset that combines multiple samples or groups.  Unlike a regular standard deviation calculated on a single sample, the pooled standard deviation allows you to merge and blend the spread of separate groups into one overall […]

View More