P-chart vs Np-chart in Lean Six Sigma. All You Need to Know
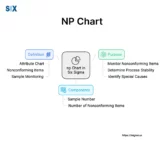
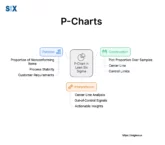
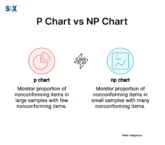
Quality monitoring relies partly on attribute charts like P chart and NP chart. P charts gauge proportions defective when test bunch sizes stay steady. NP charts instead track non-compliant units directly when batch quantities fluctuate. Both adhere to the binomial distribution modeling independent trials’ success/failure probabilities—the essential attributes a binary nature. P chart and NP […]