Weibull Distribution: A Guide to Reliability Analysis
The Weibull distribution stands as a fundamental statistical tool in Six Sigma methodology, enabling professionals to analyze and predict failure patterns in manufacturing processes and product lifecycles.
This mathematical model, developed by Swedish mathematician Waloddi Weibull in 1937, has revolutionized how quality engineers approach reliability testing and process improvement.
The significance of Weibull distribution extends beyond theoretical statistics – it serves as a practical framework for decision-making in quality control and process optimization.
Key Highlights
- Reliability Analysis Fundamentals
- Six Sigma Implementation Methods
- Parameter Estimation Techniques
- Real-World Quality Applications
What Is Weibull Distribution?
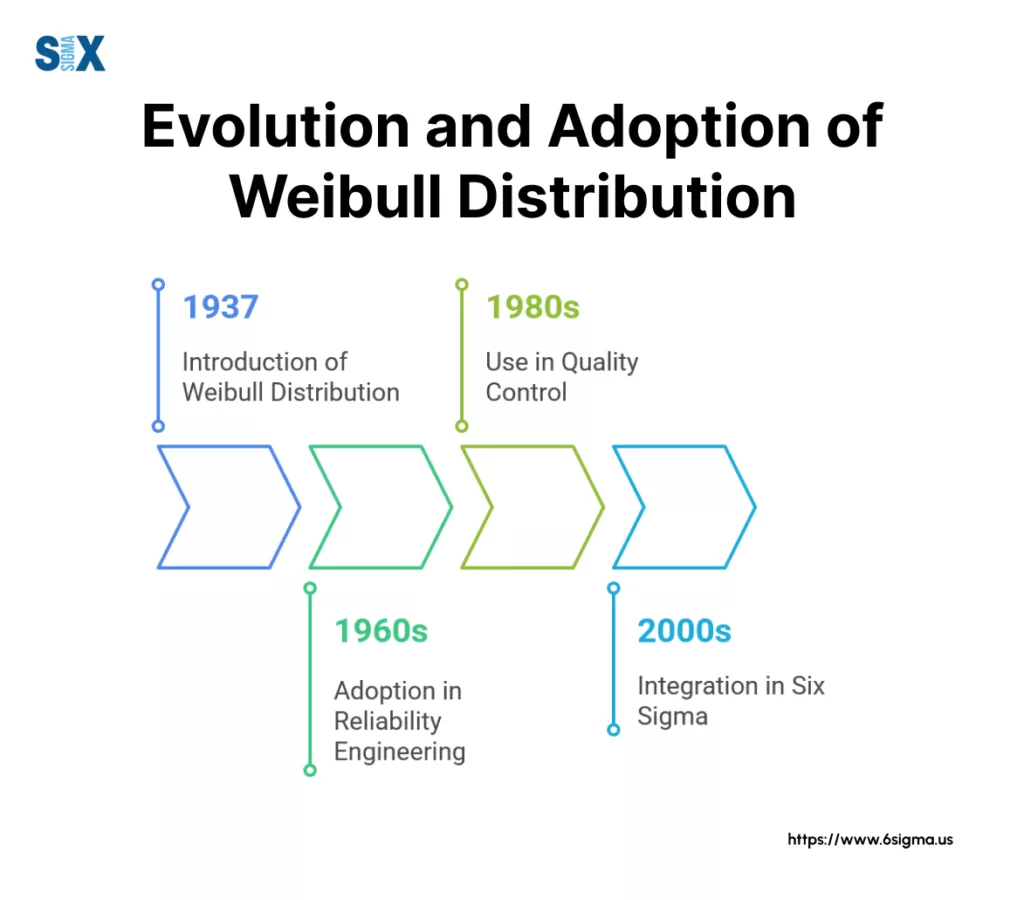
The Weibull distribution emerged as a statistical model in 1937 when Swedish mathematician Waloddi Weibull introduced it during his research on material strength testing.
His groundbreaking paper, published in 1951, presented this versatile probability distribution that would later transform reliability engineering and quality management.
Historical Development
Initially met with skepticism from the statistical community, the Weibull distribution gained recognition when the U.S. Air Force adopted it in the 1970s for aircraft failure analysis.
Evolution In Quality Management
The 1980s marked a turning point for Weibull distribution as quality management principles gained prominence in manufacturing.
Quality engineers discovered its unique ability to model both early failures and wear-out periods effectively.
This capability proved essential for implementing preventive maintenance programs and establishing quality control standards.
The distribution’s flexibility in modeling various failure patterns made it indispensable for:
- Product lifetime predictions
- Component reliability analysis
- Maintenance scheduling
- Quality improvement initiatives
Six Sigma Integration of the Weibull Distribution
Six Sigma methodology incorporated Weibull distribution analysis as a critical tool for process improvement. Quality teams use it to:
- Calculate process capability indices
- Determine optimal sampling intervals
- Predict failure rates
- Set maintenance schedules
The integration of Weibull analysis into Six Sigma projects enhanced the methodology’s effectiveness in reducing defects and improving process reliability.
Modern statistical software packages now include Weibull analysis tools, making implementation more accessible for quality professionals.
Learn how top engineers predict and prevent system failures
Learn advanced Reliability Engineering Skills with Six Sigma Green Belt

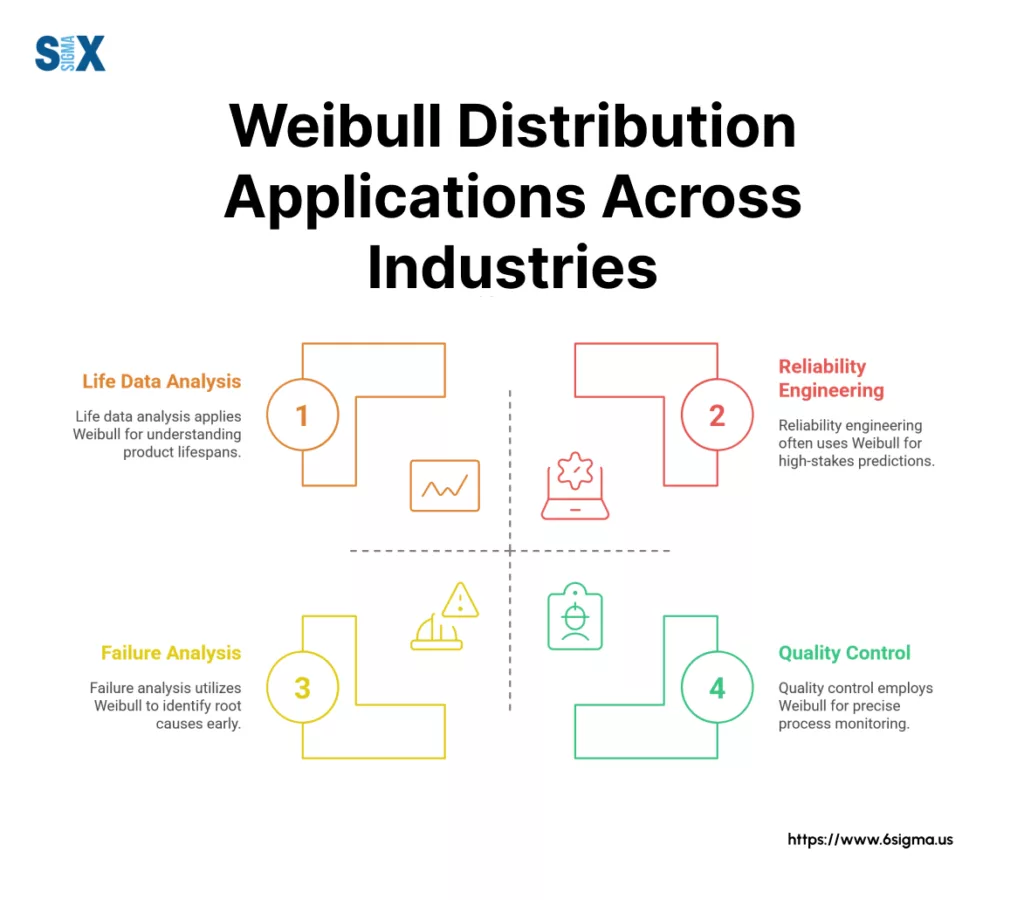
Modern Applications of Weibull Distribution
Today’s quality management systems rely heavily on Weibull distribution for data-driven decision making. Industries from aerospace to electronics manufacturing use this statistical tool to:
- Monitor production processes
- Analyze warranty claims
- Optimize maintenance intervals
- Predict component lifespans
The distribution’s mathematical properties allow quality teams to model various failure patterns, from early life failures to wear-out conditions.
This versatility makes it an essential tool in Six Sigma projects focused on reliability improvement and defect reduction.
Technical Foundation
The mathematical structure of Weibull distribution includes shape and scale parameters that enable modeling of different failure patterns.
These parameters provide quality engineers with the flexibility to analyze:
- Infant mortality in new products
- Random failures during useful life
- Wear-out failures in aging systems
- Mixed failure patterns in complex systems
This technical foundation supports evidence-based decision making in quality improvement initiatives, making Weibull distribution a cornerstone of modern reliability engineering and Six Sigma methodology.
Fundamentals of Weibull Distribution
The Weibull distribution formula provides quality engineers with a powerful tool for modeling failure patterns and product lifecycles.
This statistical model excels in reliability analysis due to its adaptable nature and ability to represent various failure behaviors through its parameters.
Basic Structure and Properties of the Weibull Distribution
The Weibull distribution parameters work together to model different failure patterns in Six Sigma projects. The probability density function follows this mathematical form:
f(x) = (β/η)(x/η)^(β-1)exp(-(x/η)^β)
This formula enables quality teams to analyze failure data and predict future outcomes with remarkable accuracy.
The function’s flexibility stems from its ability to change shape based on parameter values, making it suitable for various quality improvement scenarios.
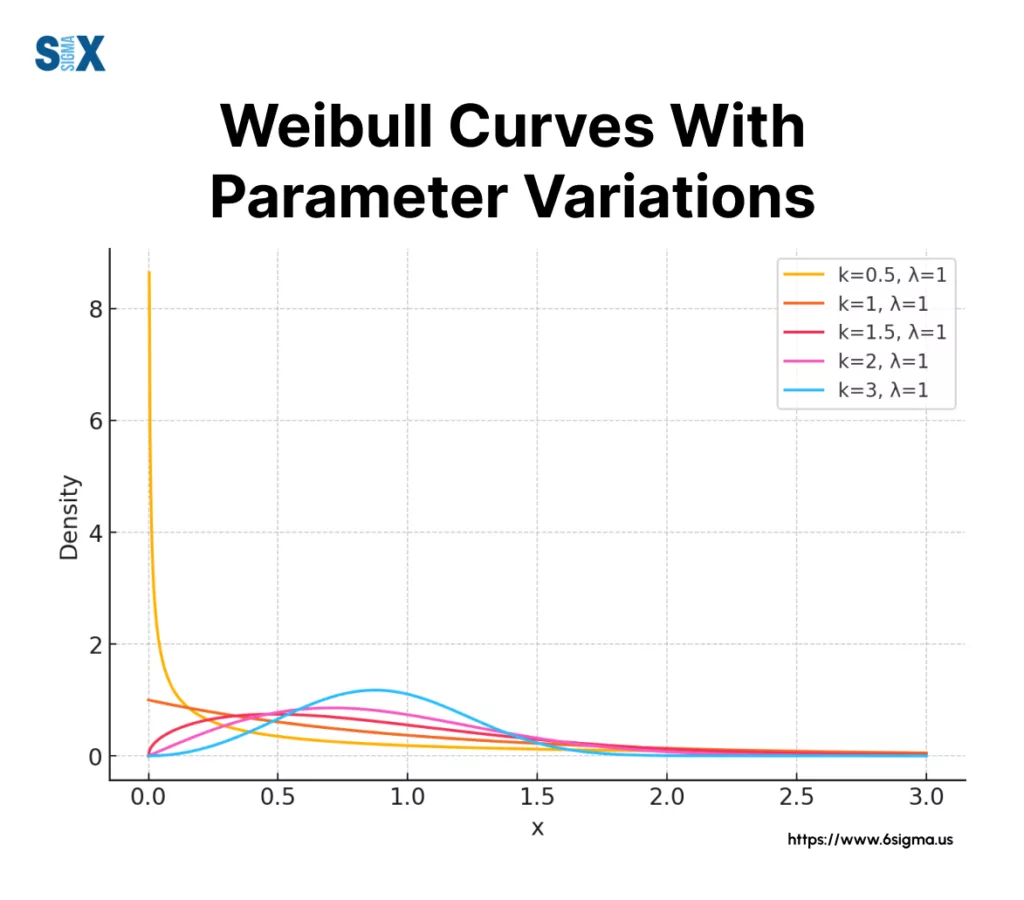
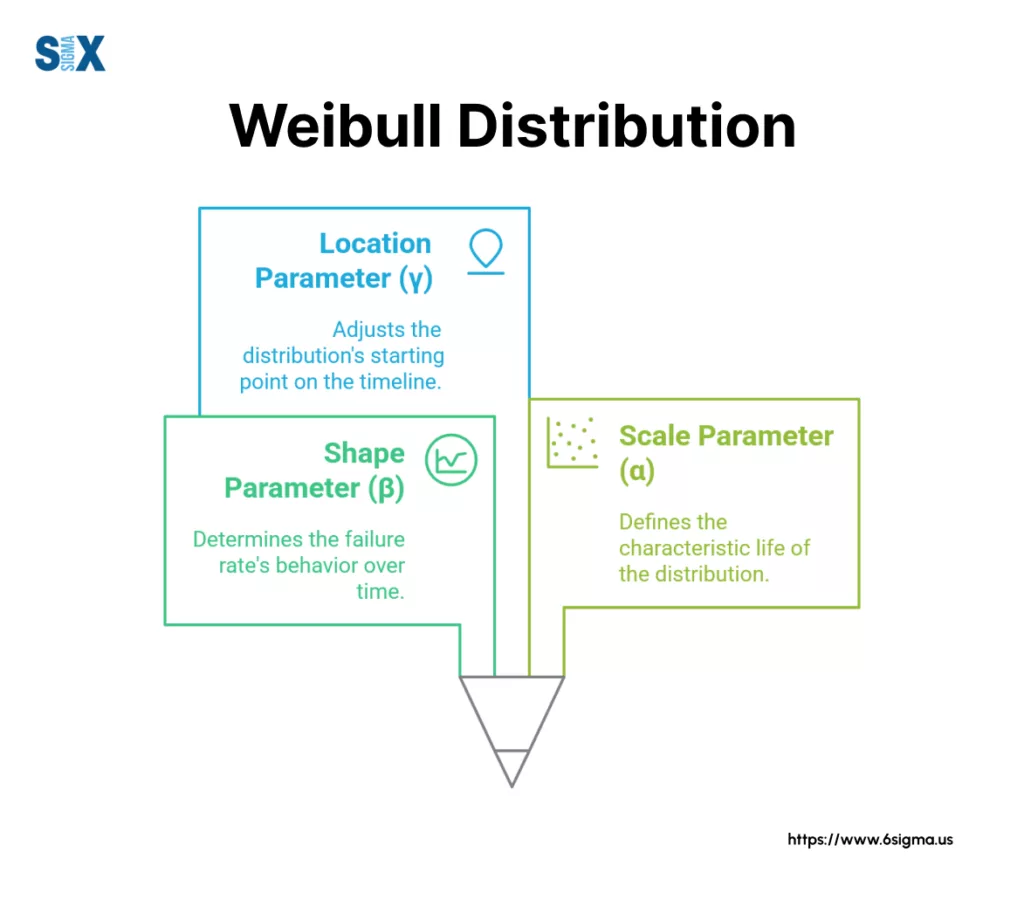
Shape Parameter (β)
The shape parameter β, also known as the slope, determines the distribution’s behavior and failure pattern. In Six Sigma applications:
β < 1: Indicates early failure or infant mortality β = 1: Shows random failures (exponential distribution) β > 1: Represents wear-out failures
Quality engineers use the shape parameter to identify failure modes and develop appropriate intervention strategies.
This parameter proves crucial in determining whether failures result from design flaws, random events, or natural wear.
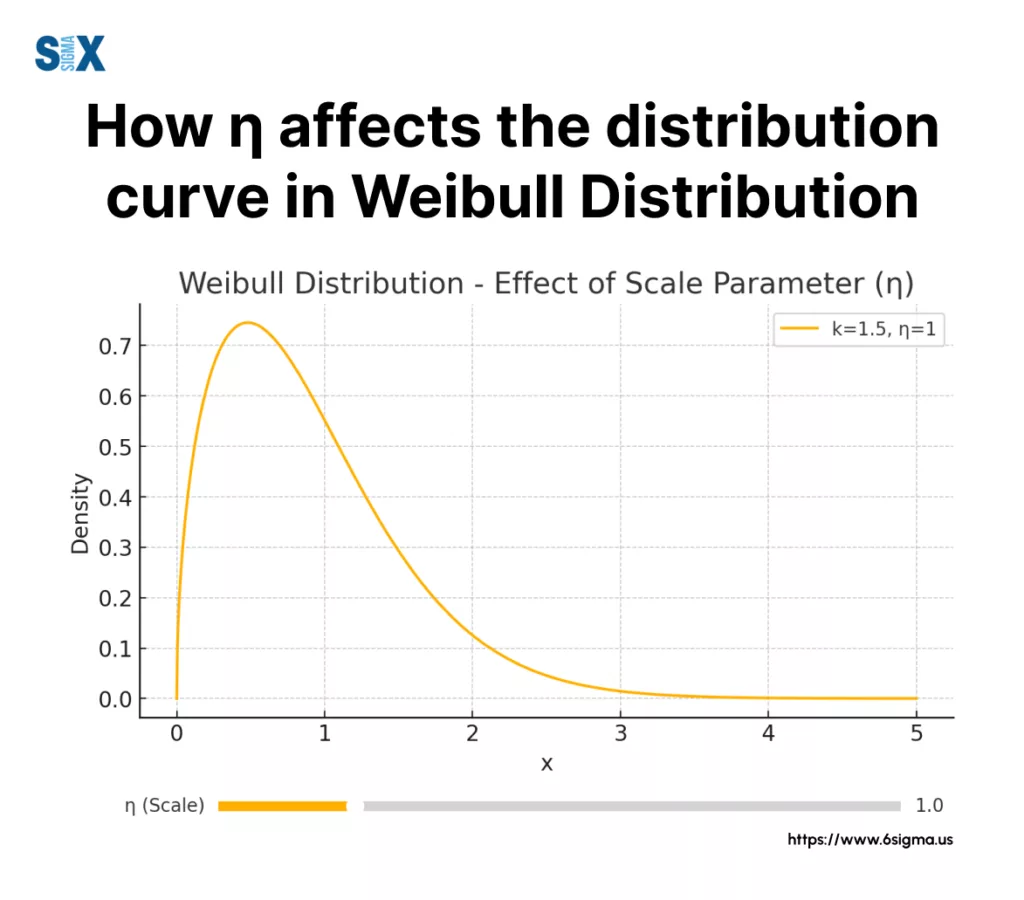
Scale Parameter (η)
The scale parameter η, also called characteristic life, defines the point at which 63.2% of units have failed.
This parameter helps quality teams:
- Set realistic reliability targets
- Plan maintenance intervals
- Establish warranty periods
- Determine replacement schedules
Understanding the scale parameter enables Six Sigma practitioners to make data-driven decisions about process improvements and maintenance planning.
Location Parameter (γ)
The location parameter γ shifts the distribution along the time axis, representing a failure-free period. This parameter proves valuable when:
- Analyzing products with guaranteed minimum lifespans
- Modeling systems with built-in redundancy
- Evaluating processes with inherent delay periods
Quality teams use the location parameter to account for guaranteed survival times in their reliability calculations.
Parameter Interaction Effects of Weibull Distribution
The interaction between Weibull distribution parameters creates distinct failure patterns that quality engineers analyze. These interactions help:
- Identify root causes of failures
- Predict future failure patterns
- Optimize maintenance strategies
- Design improvement initiatives
Understanding these parameter relationships enables Six Sigma practitioners to develop more effective quality improvement strategies.
Practical Implementation
In Six Sigma projects, teams collect failure data and estimate these parameters using:
- Maximum likelihood estimation
- Probability plotting techniques
- Statistical software analysis
- Graphical analysis methods
This systematic approach to parameter estimation ensures accurate modeling of failure patterns and reliable predictions for quality improvement initiatives.
The fundamentals of Weibull distribution provide Six Sigma practitioners with a robust framework for reliability analysis.
By understanding these parameters and their interactions, quality teams can develop more effective improvement strategies and maintenance programs.
The Mathematics Behind Weibull Distribution
The mathematical foundation of Weibull distribution equips Six Sigma practitioners with essential tools for reliability analysis.
These mathematical functions help quality teams model failure patterns and predict system behavior with statistical precision.
Probability Density Function (PDF)
The Weibull distribution function describes the probability of failure at any given time. The PDF formula is expressed as:
f(t) = (β/η)(t/η)^(β-1)exp[-(t/η)^β]
Where:
t = time
β = shape parameter
η = scale parameter
This function enables quality engineers to analyze failure patterns and identify critical periods in a product’s lifecycle.
The PDF shape varies significantly based on parameter values, providing insights into failure modes common in Six Sigma projects.
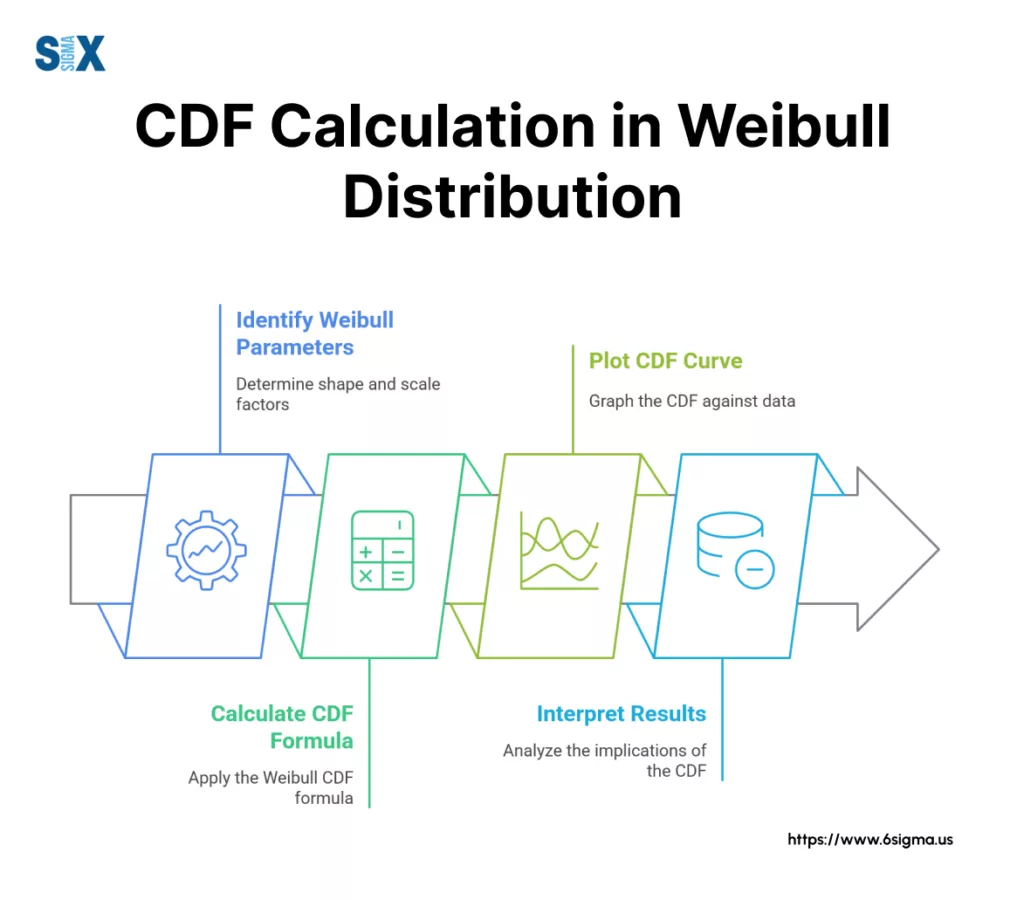
Cumulative Distribution Function (CDF)
The Weibull cumulative distribution function calculates the probability of failure up to a specific time point. The formula reads:
F(t) = 1 – exp[-(t/η)^β]
Quality teams use this function to:
- Determine warranty periods
- Set maintenance intervals
- Predict failure probabilities
- Calculate reliability metrics
Reliability Function of the Weibull Distribution
The reliability function, also known as the survival function, represents the probability of survival beyond time:
R(t) = exp[-(t/η)^β]
This mathematical relationship proves crucial for:
- Setting reliability targets
- Planning maintenance schedules
- Evaluating design improvements
- Justifying process changes
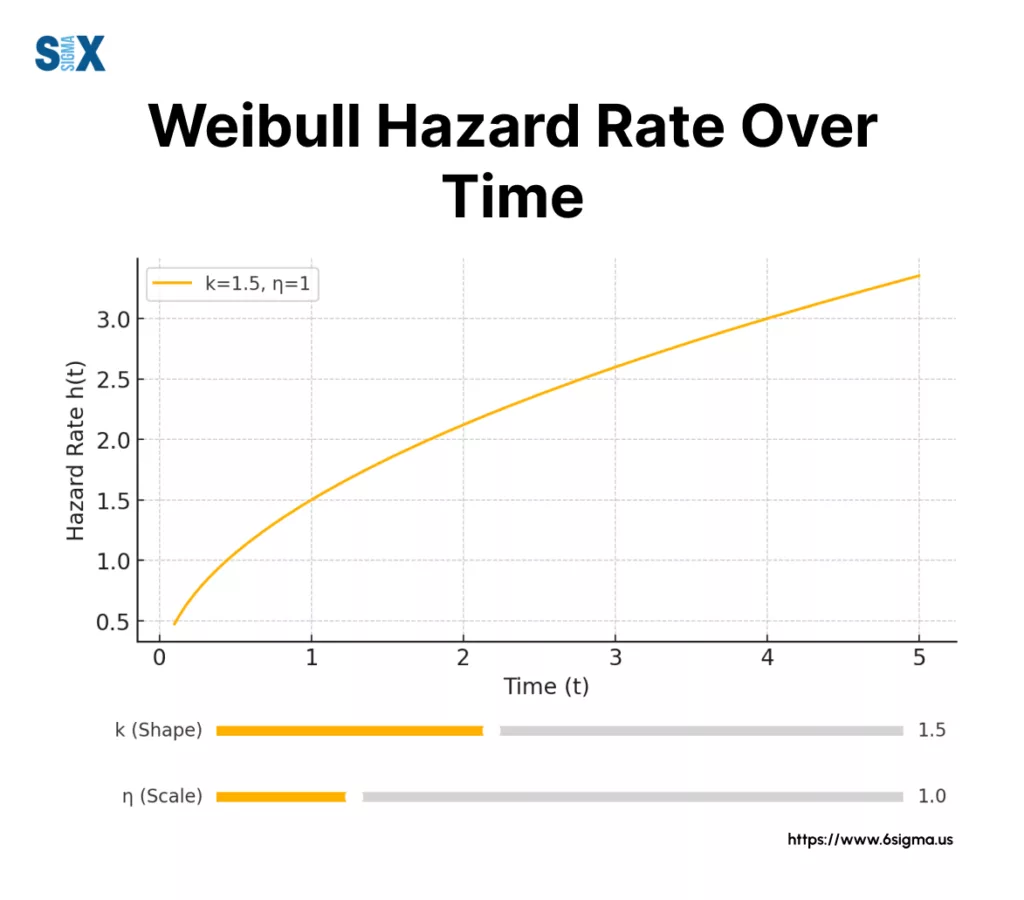
Hazard Function Analysis
The hazard function, derived from the PDF and reliability function, measures the instantaneous failure rate:
h(t) = f(t)/R(t) = (β/η)(t/η)^(β-1)
Six Sigma teams analyze this function to:
- Identify critical failure periods
- Optimize maintenance timing
- Develop prevention strategies
- Improve process reliability
Statistical Relationships of Weibull Distribution
The mathematical relationships between these functions create a powerful framework for reliability analysis in Six Sigma projects. Understanding these connections helps quality teams:
- Calculate mean time between failures
- Determine optimal replacement intervals
- Predict remaining useful life
- Establish confidence intervals
Practical Application of Weibull Distribution In Six Sigma
Quality engineers apply these mathematical concepts through:
- Statistical software analysis
- Reliability calculations
- Process capability studies
- Failure mode predictions
Parameter Estimation Methods
The practical implementation of Weibull mathematics involves estimating parameters through:
- Maximum likelihood estimation
- Probability plotting
- Least squares regression
- Graphical analysis
These mathematical tools enable Six Sigma practitioners to transform raw failure data into actionable quality improvements.
Using Weibull Distribution Tools
Modern Six Sigma practitioners rely on specialized software tools to perform Weibull analysis efficiently.
These tools streamline complex calculations and provide intuitive interfaces for data analysis and interpretation.
Software Solutions For Weibull Analysis
Statistical software packages offer dedicated modules for Weibull distribution analysis.
Popular options include Minitab, JMP, and R Programming, each providing specific advantages for quality improvement projects.
The Weibull distribution calculator functions in these tools enable quality teams to:
- Process large datasets quickly
- Generate probability plots
- Estimate distribution parameters
- Calculate confidence intervals
Master Weibull Analysis with Minitab Essentials Training
Data Input And Preparation
Quality engineers must properly format failure data before analysis. Most software tools accept:
- Raw failure times
- Censored data
- Interval data
- Grouped data
The data preparation process ensures accurate parameter estimation and reliable results for Six Sigma projects.
Analysis Methods And Techniques of Weibull Distribution
Modern tools support multiple analysis approaches:
- Maximum Likelihood Estimation (MLE)
- Probability plotting techniques
- Least squares regression
- Graphical analysis methods
Interpretation Features
Software tools provide various visualization options for interpreting results:
- Probability plots
- Survival curves
- Hazard function plots
- Confidence bounds
These visual aids help quality teams communicate findings effectively to stakeholders and make informed decisions.
Advanced Analysis Capabilities of Weibull Distribution
Contemporary Weibull analysis tools offer advanced features for:
- Mixed distribution analysis
- Competing risk assessment
- Accelerated life testing
- Reliability prediction
Report Generation And Documentation
Quality teams can generate standardized reports including:
- Parameter estimates
- Confidence intervals
- Graphical analysis
- Statistical summaries
These reports support Six Sigma documentation requirements and facilitate communication with stakeholders.
Integration With Six Sigma Projects
Modern tools integrate Weibull analysis into broader Six Sigma initiatives through:
- Project templates
- Custom macros
- Automated workflows
- Data sharing capabilities
This integration streamlines the analysis process and ensures consistency across quality improvement projects.
Tool Selection Guidelines of Weibull Distribution
When selecting Weibull analysis tools, consider:
- Project requirements
- Data volume
- Analysis complexity
- Team expertise
- Budget constraints
Common Calculation Methods of Weibull Distribution
Quality engineers typically employ these calculation methods:
- Rank regression
- Maximum likelihood
- Bayesian analysis
- Monte Carlo simulation
Understanding these methods helps teams choose appropriate analysis approaches for their specific needs.
Data Export And Sharing
Modern tools support various data export formats:
- Excel spreadsheets
- PDF reports
- HTML documents
- Interactive dashboards
This flexibility enables effective communication of results across different platforms and stakeholders.
Weibull Distribution vs Other Statistical Methods
Statistical distributions play distinct roles in Six Sigma methodology, each offering unique advantages for specific analysis scenarios.
Understanding these differences helps quality teams select the most appropriate tool for their projects.
Comparison of Weibull Distribution With Normal Distribution
The normal distribution assumes symmetrical data patterns, while the Weibull distribution handles asymmetrical failure patterns effectively.
In manufacturing processes, normal distribution suits quality characteristic measurements, whereas Weibull distribution excels in reliability analysis.
Weibull Distribution vs Pareto Analysis
While Pareto analysis focuses on categorizing defects by frequency, Weibull distribution analyzes time-to-failure patterns.
Quality teams often use both methods complementarily – Pareto for defect prioritization and Weibull for reliability predictions.
Selection Criteria For Distribution Methods
The choice between statistical methods depends on:
- Data characteristics
- Analysis objectives
- Process behavior
- Required accuracy
Implementation Guide For Six Sigma Practitioners
Successful implementation of Weibull analysis requires structured approaches to data collection, analysis, and interpretation within Six Sigma projects.
Data Collection Strategies of Weibull Distribution
Quality teams must gather:
- Failure times
- Suspension data
- Operating conditions
- Environmental factors
This information forms the foundation for reliable Weibull analysis in process improvement initiatives.
Analysis Procedures
The analysis process follows these key steps:
- Data validation
- Parameter estimation
- Model fitting
- Goodness-of-fit testing
- Results interpretation
Interpretation Guidelines
Quality engineers should focus on:
- Parameter significance
- Confidence intervals
- Failure patterns
- Reliability predictions
These elements guide decision-making in Six Sigma improvement projects.
Become a Six Sigma Leader in Reliability Analysis with Six Sigma Champion – Leadership Program
The Road Ahead
The Weibull distribution serves as a powerful tool in Six Sigma methodology, offering unique advantages for reliability analysis and process improvement.
Its flexibility in modeling various failure patterns makes it invaluable for quality engineering applications.
Key takeaways for practitioners:
- Choose appropriate distribution methods based on data characteristics
- Follow structured implementation procedures
- Interpret results within project context
- Apply findings to process improvements
Future Applications
The role of Weibull distribution in Six Sigma continues to evolve with:
- Advanced software capabilities
- Machine learning integration
- Real-time analysis methods
- Predictive maintenance applications
These developments enhance the effectiveness of quality improvement initiatives.
Quality teams should maintain focus on practical applications while ensuring statistical validity in their analyses.
SixSigma.us offers both Live Virtual classes as well as Online Self-Paced training. Most option includes access to the same great Master Black Belt instructors that teach our World Class in-person sessions. Sign-up today!
Virtual Classroom Training Programs Self-Paced Online Training Programs


