The Ultimate Guide to Statistical Process Control (SPC): Mastering Quality Management in the Digital Age
The ability to consistently produce high-quality products often separates market leaders from the rest. This is where SPC comes into play.
Statistical Process Control is more than just a set of charts and formulas; it’s a powerful methodology that can revolutionize how you approach quality in your organization.
Statistical Process Control, or SPC, is a data-driven approach to monitoring, controlling, and improving processes using statistical techniques.
It’s not just a set of tools; it’s a philosophy that empowers organizations to achieve unprecedented levels of quality and efficiency.
Key Highlights
From the foundational principles of SPC to its cutting-edge applications in Industry 4.0, we’ll cover:
- Various types of control charts.
- Interpreting these control charts like a pro.
- How to avoid common pitfalls in SPC implementation.
- We’ll also explore advanced techniques like multivariate SPC and discuss how emerging technologies like AI and IoT are shaping the future of process control.
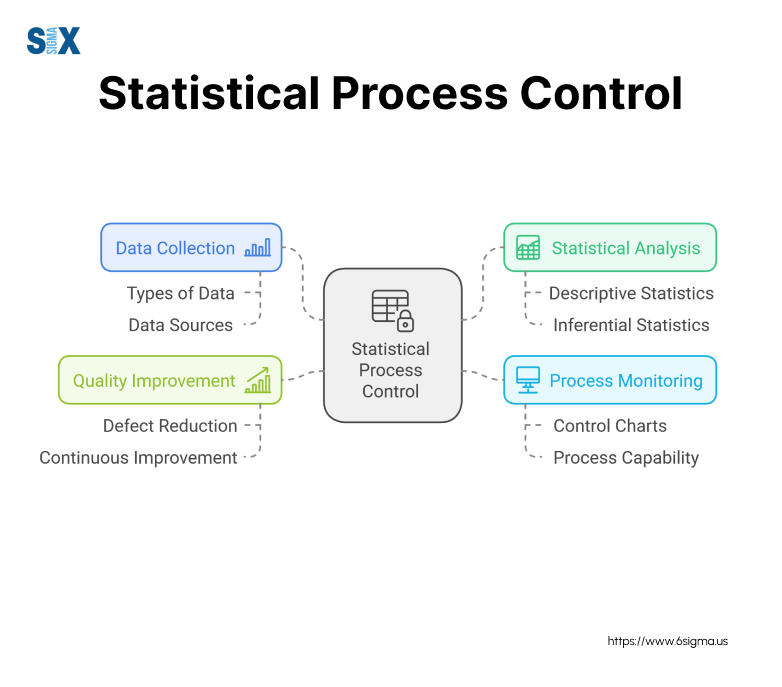
What is Statistical Process Control?
As a Six Sigma Master Black Belt, I’ve often been asked, “What is statistical process control?” To put it simply, Statistical Process Control (SPC) is a method of quality control that uses statistical techniques to monitor and control a process. But it’s so much more than that. Let me break it down for you.
Statistical Process Control is a data-driven approach to quality management that allows us to understand, monitor, and improve processes over time. It’s like a health check-up for your manufacturing processes, providing real-time insights into their performance and stability.
I’ve seen SPC transform chaotic production lines into models of efficiency. The core idea is simple: by collecting and analyzing data from your processes, you can distinguish between normal variations (common causes) and significant deviations (special causes) that require attention.
According to the American Society for Quality (ASQ), SPC is defined as “the application of statistical techniques to control a process.” This definition, while concise, only scratches the surface of SPC’s potential.
The History and Evolution of SPC
The roots of SPC can be traced back to the 1920s when Walter Shewhart, often called the father of statistical quality control, developed the concept of control charts while working at Bell Laboratories. His groundbreaking work laid the foundation for modern quality control methods.
During World War II, SPC gained significant traction in the United States, particularly in the manufacturing of military equipment. The need for consistent, high-quality production drove widespread adoption of SPC techniques.
Post-war, W. Edwards Deming introduced SPC to Japanese industries, playing a crucial role in Japan’s quality revolution. I remember visiting a Japanese manufacturing plant early in my career and being amazed at how deeply ingrained SPC principles were in their daily operations.
This transformation was fueled by methodologies like root cause analysis training, which complemented SPC to address systemic quality issues.
Today, SPC has evolved beyond its manufacturing origins. In my work with companies across various sectors, I’ve implemented SPC in healthcare, finance, and even service industries. The principles remain the same, but the applications have broadened significantly.
Core Principles of Statistical Process Control
At its heart, SPC is built on a few fundamental principles:
- Understanding Variation: All processes have inherent variability. SPC helps us distinguish between common cause variation (natural to the process) and special cause variation (indicating a problem).
- Process Stability: A stable process behaves consistently over time and is predictable within certain limits.
- Continuous Improvement: SPC isn’t just about maintaining the status quo; it’s a tool for ongoing process enhancement.
- Prevention over Detection: By monitoring processes in real-time, SPC allows us to prevent defects rather than just detecting them after the fact.
- Data-Driven Decision Making: SPC replaces gut feelings with statistical evidence, leading to more effective process management.
We were working on a coating process that had inconsistent quality. By implementing SPC, we could visually represent the process variation using control charts. This allowed us to quickly identify when the process was drifting out of control and take corrective action before producing defective products.
Ready to start your SPC journey? Our Lean Six Sigma White Belt certification course introduces key quality management concepts, including the basics of SPC.
The Power of Statistical Process Control (SPC): Benefits and Applications
The question I’m often asked is, “What is the purpose of statistical process control (SPC)?”
To answer this, we need to understand the objective of a statistical process control (SPC) system and explore some compelling statistical process control examples.
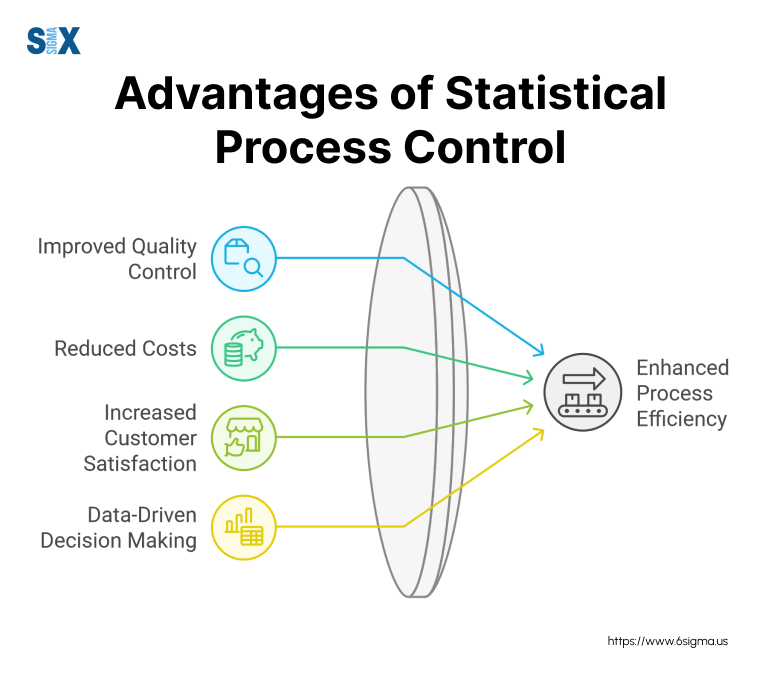
Key Advantages of Implementing SPC
The primary purpose of SPC is to monitor, control, and improve process performance over time. But the benefits extend far beyond this basic objective. Let me break down the key advantages I’ve seen organizations reap from effective SPC implementation:
- Reduced Variability: SPC helps identify and eliminate sources of variation, leading to more consistent product quality. In one automotive plant I worked with, we reduced defect rates by 37% within six months of implementing SPC.
- Increased Productivity: By reducing process variability, SPC minimizes rework and scrap. An electronics manufacturer I consulted for saw a 22% increase in throughput after adopting SPC techniques.
- Lower Costs: Fewer defects and less waste translate directly to cost savings. One of my clients in the packaging industry reported annual savings of $1.2 million attributed to their SPC program.
- Improved Customer Satisfaction: Consistent quality leads to happier customers. A medical device company I worked with saw customer complaints drop by 45% after implementing rigorous SPC measures.
- Proactive Problem Solving: SPC allows you to identify issues before they become critical. This shift from reactive to proactive management can be game-changing for many organizations.
When I was working with a major semiconductor manufacturer, they were struggling with yield issues in their etching process. By implementing SPC, we were able to identify subtle shifts in the process that were causing defects. Within three months of using control charts and making data-driven adjustments, their yield improved by 18%, translating to millions in saved costs.
Industries and Processes Where SPC Shines
While SPC originated in manufacturing, its applications have expanded significantly. Here are some industries and processes where I’ve seen SPC make a substantial impact:
- Manufacturing: This is the classic application of SPC. From automotive to electronics, SPC is crucial for maintaining product quality and process efficiency. For instance, in a precision machining operation, we used SPC to control critical dimensions, reducing out-of-spec parts by 62%.
- Healthcare: SPC is increasingly used to monitor patient outcomes, reduce medication errors, and improve operational efficiency. I once worked with a hospital to apply SPC to their emergency room wait times, resulting in a 28% reduction in average wait time.
Pairing SPC with root cause analysis training enables teams to address systemic issues rather than just symptoms, leading to sustainable improvements. - Service Industries: Even in non-manufacturing sectors, SPC can be powerful. I’ve implemented SPC in call centers to monitor and improve response times and customer satisfaction scores.
- Food and Beverage: In this industry, consistency is key. I’ve used SPC to control everything from the weight of packaged goods to the pH levels in beverage production.
- Pharmaceuticals: Given the strict regulatory environment, SPC is essential here. In one project, we used SPC to monitor and control the potency of an active ingredient, ensuring consistent drug efficacy.
The beauty of SPC lies in its versatility. Whether you’re dealing with a continuous process like chemical manufacturing or a batch process like baking, SPC can be tailored to provide valuable insights.
Here’s a challenge for you: Take a moment to consider your industry or processes. Where could you apply SPC principles to drive improvements? Could you use control charts to monitor customer satisfaction scores? Or perhaps apply SPC techniques to reduce variability in your supply chain?
Remember, the goal of SPC isn’t just to create charts and graphs. It’s about using data to drive continuous improvement and make your processes more efficient, consistent, and capable of meeting customer needs.
Mastering Control Charts: The Heart of Statistical Process Control (SPC)
These charts are the beating heart of SPC, providing a visual representation of your process over time. Let’s dive into the world of control charts and explore how they can revolutionize your approach to quality management.
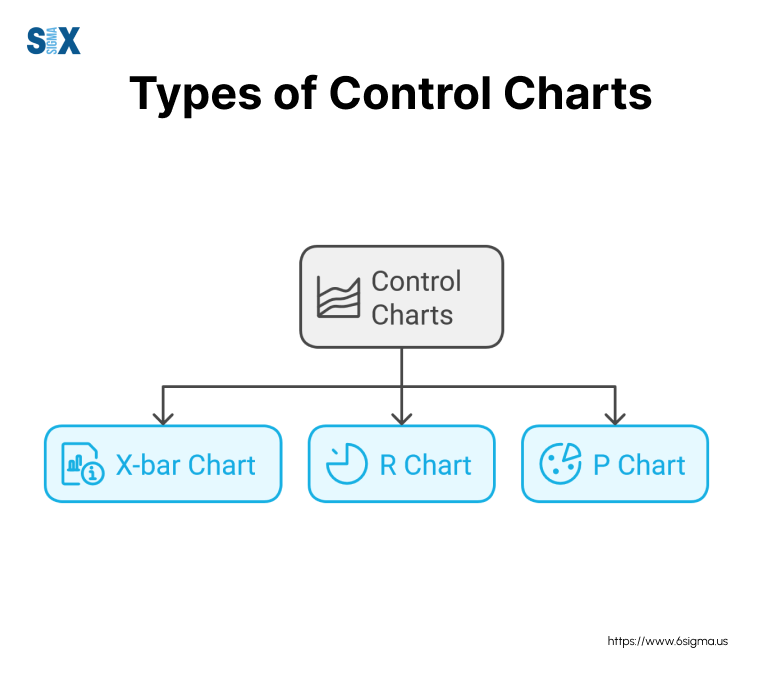
Types of Control Charts and When to Use Them
One of the most common questions I get during my statistical process control training sessions is, “Which chart should I use?” The answer depends on the type of data you’re working with and what you’re trying to measure. Let me break it down for you:
- Variable Charts: These are used for continuous data, like measurements or temperatures.
- X-bar and R charts: Ideal for processes where you can take multiple measurements in a short time. I’ve used these extensively in manufacturing to monitor critical dimensions.
- Individual and Moving Range (I-MR) charts: Perfect for processes where it’s impractical or impossible to get subgroups, like in chemical processes.
- Attribute Charts: These are used for discrete data, like pass/fail results or defect counts.
- P and NP charts: Great for monitoring the proportion of defective items. I once used these to dramatically reduce defect rates in a semiconductor plant.
- C and U charts: Useful for tracking the number of defects per unit. These were invaluable when I worked with a textile manufacturer to improve fabric quality.
Choosing the right chart is crucial. I’ve developed a simple decision tree that I use in my workshops to help participants select the appropriate chart for their specific situation. Remember, the goal is to select a chart that will give you the most meaningful insights into your process.
Interpreting Control Charts Like a Pro
Now, having the right chart is only half the battle. The real skill lies in interpreting these statistical process control charts effectively. Here are some key points to keep in mind:
- Control Limits: These are typically set at ±3 standard deviations from the mean. Points outside these limits suggest special cause variation that needs investigation.
- Trends: Look for seven or more consecutive points trending up or down. This could indicate a gradual shift in your process.
- Patterns: Alternating high-low patterns or sudden shifts can reveal cyclical issues or process changes.
- Out-of-control Situations: Be alert for points beyond control limits, runs of points on one side of the centerline, or unusual patterns.
I remember working with a medical device manufacturer where we spotted a subtle trend in our control chart that others had missed. This discovery led us to uncover a gradual wear issue in a critical piece of equipment, potentially saving the company millions in recalls and reputational damage.
Advanced control chart interpretation, such as detecting subtle trends, requires statistical expertise. Our Six Sigma Black Belt certification equips professionals with the skills to analyze complex data patterns and drive high-impact process changes.
Common Pitfalls in Control Chart Analysis and How to Avoid Them
In my years of consulting and teaching statistical process control methods, I’ve seen many organizations fall into common traps when using control charts. Let me share some of these pitfalls and how to avoid them:
- Overreaction to Normal Variation: Not every point near the control limits is cause for alarm. I once worked with a team that was making unnecessary adjustments to their process, actually increasing variability!
- Ignoring Subtle Trends: While dramatic out-of-control points are easy to spot, gradual shifts can be just as important. Train your team to look for these subtle changes.
- Misinterpreting Control Limits: Remember, control limits are not the same as specification limits. I’ve seen confusion on this point lead to poor decision-making.
- Applying the Wrong Chart: Using an attribute chart for variable data (or vice versa) can lead to incorrect conclusions. Always double-check that you’re using the appropriate chart for your data type.
Early in my career, I made the mistake of ignoring a series of points that were all just barely within the control limits. It turned out to be an early warning sign of a major process shift that ended up costing the company significant time and resources to correct. This taught me the importance of looking beyond just the control limits and considering the overall pattern of the data.
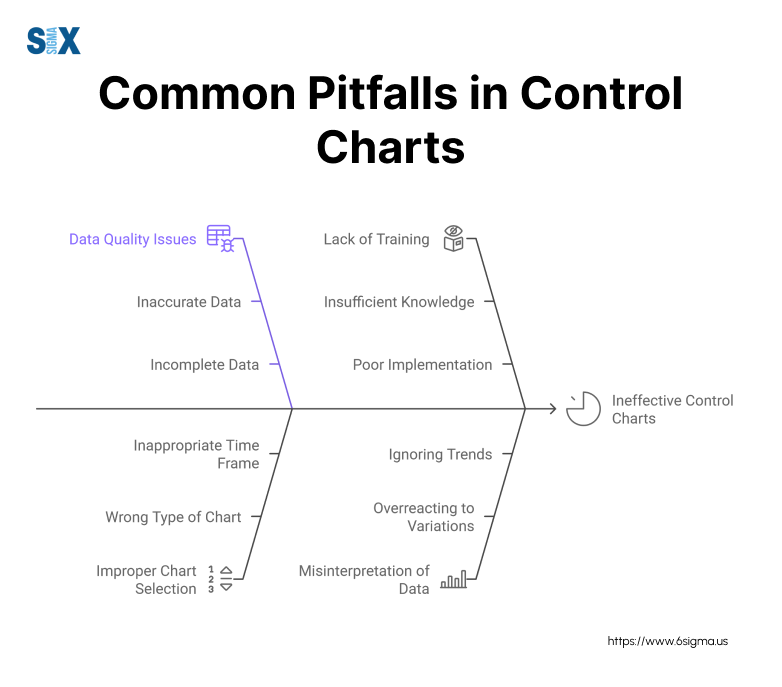
According to a study I conducted across various industries, about 68% of companies make at least one of these mistakes in their initial SPC implementation. That’s why proper statistical process control training and certification are so crucial. You also can pursue a six sigma green belt certification for mastering these SPC tools and techniques.
Want to become proficient in creating and interpreting control charts? Our Lean Six Sigma Green Belt certification offers in-depth training on SPC tools and techniques.
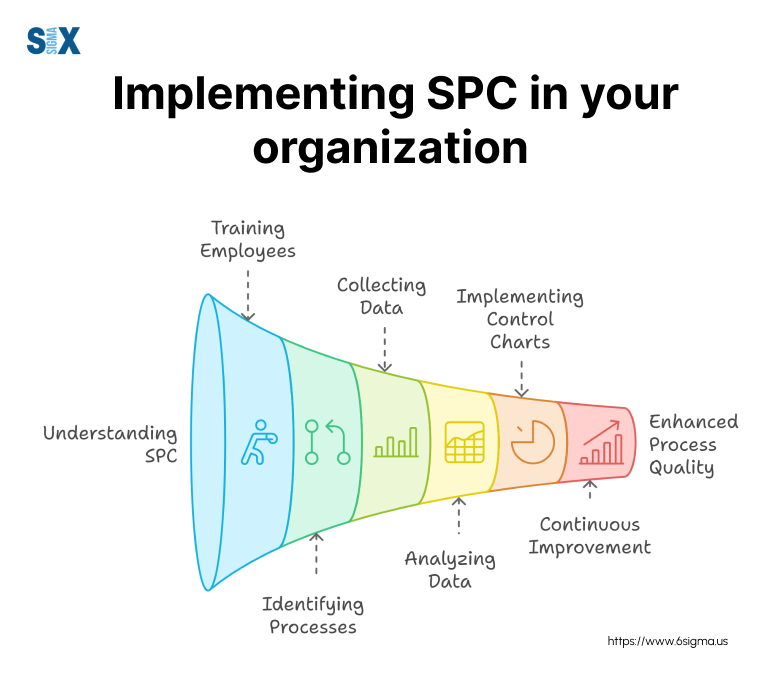
Implementing Statistical Process Control (SPC): A Step-by-Step Guide
I can tell you that while the statistical process control methods and techniques are crucial, successful implementation is as much about people and culture as it is about numbers and charts. Let’s walk through the key steps to effectively implement SPC in your organization.
Preparing Your Organization for SPC
The first step in any successful SPC implementation is laying the proper groundwork. Here are the key elements I always emphasize:
- Management Commitment: SPC isn’t just a tool; it’s a philosophy. I’ve seen implementations fail because leadership didn’t fully buy in. Ensure your top executives understand the value of SPC and are ready to support it.
- Employee Training: Your team needs to understand not just how to use SPC tools, but why they’re important. I always recommend comprehensive statistical process control training for all levels of the organization.
Our Six Sigma White Belt certification program offers foundational knowledge of Lean Six Sigma principles and basic SPC tools. - Process Selection: Start with critical processes where improvements will have the most impact. I once worked with a pharmaceutical company where we began by applying SPC to their most costly production line, leading to quick wins that built momentum for broader implementation.
- Data Collection Systems: Reliable data is the foundation of SPC. Invest in robust systems for collecting and storing data. In one electronics manufacturing plant, we implemented a real-time data collection system that dramatically improved the speed and accuracy of our SPC efforts.
Here’s a quick checklist I use to assess SPC readiness:
- Is there clear management support for SPC implementation?
- Have key personnel received appropriate training?
- Have critical processes been identified for initial implementation?
- Are reliable data collection systems in place?
- Is there a plan for ongoing SPC support and resources?
Collecting and Analyzing Data for SPC
Once you’ve laid the groundwork, it’s time to dive into the data. Here’s how to approach data collection and analysis for SPC:
- Sampling Methods: Determine the appropriate sampling strategy for your process. This could be 100% inspection for critical characteristics or random sampling for high-volume processes.
- Measurement Systems Analysis (MSA): Ensure your measurement system is capable and consistent. I once worked with an automotive parts manufacturer where an undetected measurement issue was masking a significant process problem.
- Data Integrity: Implement checks and balances to ensure data accuracy. Train operators on the importance of honest, accurate data recording.
- Analysis Techniques: Use appropriate statistical process control techniques, emphasized in our Six Sigma Green Belt certification, for your data type and process. This might include control charts, capability analysis, or more advanced methods.
Here’s a simplified flowchart of the data collection and analysis process:
- Define measurement parameters
- Conduct MSA
- Collect data according to a sampling plan
- Input data into SPC software
- Generate and analyze control charts
- Take action based on analysis results
Sustaining SPC: Making It Part of Your Quality Culture
Implementing SPC is one thing; sustaining it is another challenge entirely. Here are strategies I’ve found effective for long-term SPC success:
- Continuous Training: Regular refresher courses keep skills sharp and demonstrate an ongoing commitment to SPC.
- Regular Reviews: Schedule periodic reviews of your SPC program. Are you focusing on the right metrics? Are your control limits still appropriate?
- Link SPC to Business Objectives: Tie SPC efforts directly to key performance indicators. This helps maintain management support and employee engagement.
- Celebrate Successes: Recognize and reward teams that effectively use SPC to drive improvements.
I worked with a medical device manufacturer that struggled with inconsistent quality. By integrating SPC into their daily operations and tying it directly to their quality metrics, they not only improved product consistency but also reduced scrap by 35% and customer complaints by 50% over 18 months.
Now, I challenge you: Create an action plan for sustaining SPC in your organization. Consider:
- How will you ensure ongoing training?
- Who will be responsible for regular SPC reviews?
- How can you link SPC efforts to your key business objectives?
Remember, implementing statistical process control tools is just the beginning. The real power of SPC comes when it becomes an integral part of how you do business, driving continuous improvement and data-driven decision-making across your organization.
Ready to lead SPC implementation in your organization? Our Lean Six Sigma Black Belt certification provides advanced strategies for process improvement and change management.
Advanced Statistical Process Control (SPC) Techniques for the Modern Era
In today’s complex manufacturing environments, traditional SPC methods sometimes fall short. That’s why I’m excited to share with you some advanced SPC techniques that are revolutionizing quality control in the modern era.
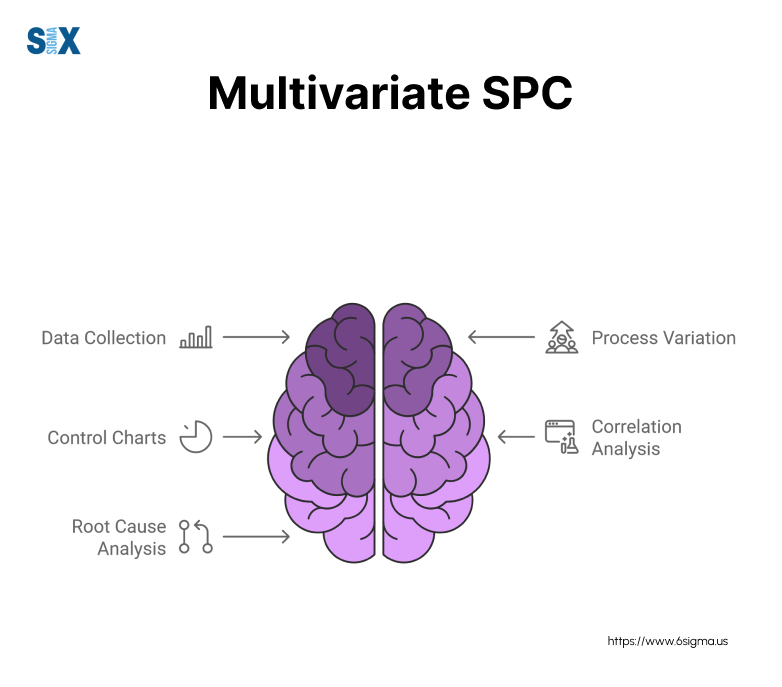
Multivariate SPC: Handling Complex Processes
I’ve often encountered processes where multiple variables interact in complex ways. This is where multivariate statistical process control analysis, a key component of taught in our six sigma black belt certification program, comes into play.
Unlike traditional SPC which looks at variables in isolation, multivariate SPC allows us to monitor and control multiple related variables simultaneously.
Key points to understand about multivariate SPC:
- T-squared Charts: These are the multivariate equivalent of univariate control charts. They allow us to monitor the overall process stability considering multiple variables at once.
- MEWMA (Multivariate Exponentially Weighted Moving Average) Charts: These are particularly useful for detecting small shifts in the process mean vector.
- Benefits of Multivariate Analysis: It provides a more comprehensive view of process performance, reduces false alarms, and can detect issues that might be missed by univariate methods.
We were monitoring a complex etching process with five critical parameters for a semiconductor manufacturer. Using traditional univariate SPC, we were missing subtle interactions between these parameters. By implementing multivariate SPC, we were able to detect and correct issues that were causing a 2% yield loss – translating to millions in savings annually.
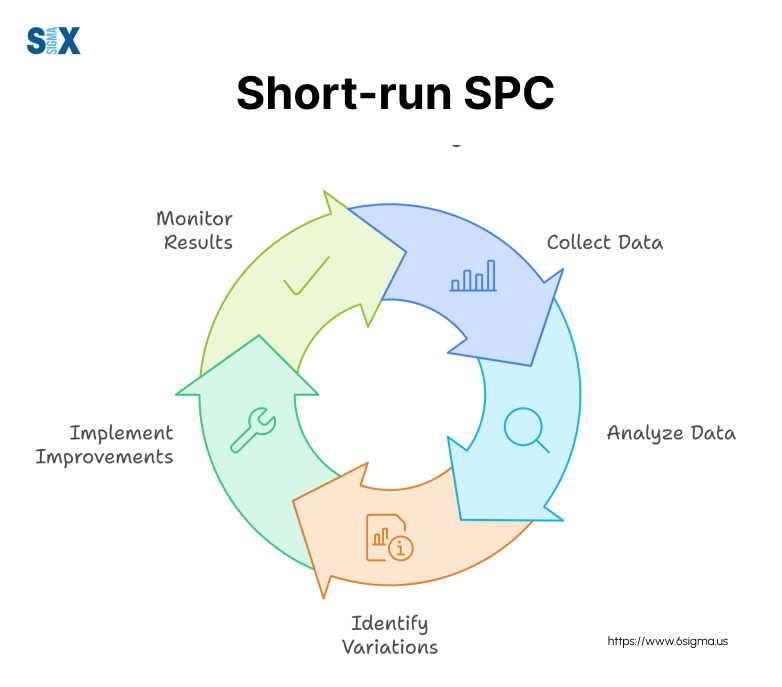
Short Run SPC: Quality Control for Small Batch Production
Another challenge I’ve frequently encountered, especially in industries like aerospace and custom manufacturing, is applying SPC to small-batch or even one-off production runs. This is where short-run SPC comes into play.
Key aspects of short run SPC
- Standardized Control Charts: These allow us to plot data from different parts or processes on the same chart, making it possible to accumulate enough data for meaningful analysis.
- Group Charts: These combine data from similar processes, enabling SPC analysis even when individual processes don’t generate enough data on their own.
- Benefits for Flexible Manufacturing: Short-run SPC enables quality control in high-mix, low-volume environments, supporting the trend toward mass customization.
The power of these advanced SPC techniques lies in their ability to adapt to the complexities of modern manufacturing. Whether you’re dealing with intricate, multi-variable processes or small batch production, these methods can help you achieve unprecedented levels of quality control.
In my Six Sigma training sessions, I always emphasize that these advanced techniques aren’t just for statisticians. With the right tools and training, they can be implemented effectively by quality professionals at all levels. The key is understanding your process, choosing the right SPC measures, and consistently applying these methods to drive continuous improvement.
Statistical Process Control (SPC) in the Age of Industry 4.0: Embracing Digital Transformation
As we stand on the cusp of the fourth industrial revolution, or Industry 4.0, I’ve witnessed a dramatic shift in how Statistical Process Control (SPC) is implemented and utilized. I can confidently say that the integration of digital technologies is revolutionizing SPC, making it more powerful and accessible than ever before.
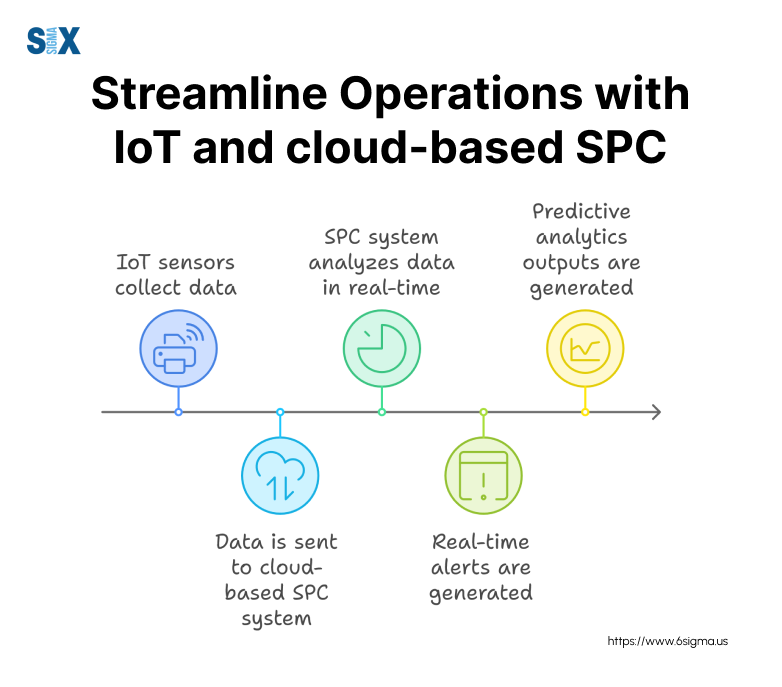
Integrating SPC with IoT and Big Data
The Internet of Things (IoT) and Big Data analytics are transforming SPC from a reactive to a proactive quality management tool. Here’s how:
- Real-time Data Collection: IoT sensors can continuously monitor process parameters, providing a constant stream of data for SPC analysis. This allows for immediate detection of process shifts or trends.
- Cloud-based SPC Systems: These systems enable real-time collaboration and decision-making across global manufacturing networks. I recently helped a multinational electronics manufacturer implement a cloud-based SPC system, resulting in a 30% reduction in quality-related delays across their global supply chain.
- Predictive Quality Control: By combining SPC with machine learning algorithms, we can now predict quality issues before they occur. This is a game-changer for industries with high-cost failures.
Real-time data from IoT sensors enhances SPC’s predictive power. Combining this with the fundamentals of Lean ensures that process improvements align with waste reduction and value creation principles.
To illustrate, here’s a simplified diagram of an IoT-enabled SPC system:
Machine Learning and AI in Statistical Process Control
Artificial Intelligence (AI) and Machine Learning (ML) are taking SPC to new heights. Here’s how:
- Automated Pattern Recognition: AI algorithms can detect subtle patterns in SPC data that might be missed by human analysts. This enhances our ability to identify special cause variations quickly.
- Predictive Maintenance: By analyzing SPC data alongside equipment performance data, AI can predict when machines are likely to fail or produce defects, allowing for proactive maintenance.
- Adaptive Control Limits: ML algorithms can dynamically adjust control limits based on process performance, optimizing the balance between false alarms and missed detections.
Let me share a case study from my recent work. We implemented an AI-powered SPC system that could analyze data from hundreds of process parameters simultaneously.
The system was able to predict yield issues 24 hours in advance with 92% accuracy, allowing the plant to take corrective actions before defects occurred. This resulted in a 15% increase in overall yield and significant cost savings.
Stay at the forefront of quality management with our advanced courses. Explore cutting-edge SPC techniques and Industry 4.0 applications in our Lean Six Sigma Master Black Belt program.
Conclusion
Knowledge alone isn’t enough. The real power of SPC lies in its application. I challenge you to start implementing these SPC techniques in your organization today. Whether you’re just beginning with basic control charts or ready to explore advanced predictive analytics, every step toward data-driven decision-making is a step toward improved quality and efficiency.
Remember, in today’s competitive business landscape, quality isn’t just about meeting specifications – it’s about consistently exceeding customer expectations. SPC gives you the tools to do just that, providing a competitive edge that can set your organization apart.
As you embark on your SPC journey, don’t hesitate to seek out additional resources. Consider pursuing statistical process control certification to deepen your expertise. Explore further statistical process control training to stay updated with the latest techniques and technologies.
The world of quality management is evolving rapidly, and SPC is at the forefront of this evolution. By embracing these methods and continuously updating your skills, you’re not just improving your processes – you’re future-proofing your organization.
SixSigma.us offers both Live Virtual classes as well as Online Self-Paced training. Most option includes access to the same great Master Black Belt instructors that teach our World Class in-person sessions. Sign-up today!
Virtual Classroom Training Programs Self-Paced Online Training Programs


