SPC Charts: The Ultimate Guide to Statistical Process Control & Quality
Introduced by Walter Shewhart’s pioneering work and then enhanced through W. Edwards Deming, SPC charts offer visual representations showcasing workflow shifts.
Organizations pursue steady excellence, leading to widespread Statistical Process Control adoption – a potent tool for observation, analysis, and progression.
By graphing data against calculated boundaries, charts discern natural flux from source-worthy deviations.
SPC charts strength springs from identifying instability, spotting tendencies, and assessing capability.
With such sights, organizations proactively tackle concerns, refine processes and amplify quality, client fulfillment, and productivity in enduring balance.
For continual problem-solvers committed to understanding nature’s dances through numbers, SPC charts emerge as trusted partners.
This discussion explores techniques illuminating patterns amid complexities for reliable discoveries and betterments wherever evidence guides progress together.
Key Highlights
- Understanding the fundamentals of SPC charts, including common cause vs. special cause variation, chart components (centerline, control limits), and different chart types for variables and attribute data.
- Recognizing when to utilize SPC charts for monitoring process performance, detecting instability, assessing capability, and driving continuous improvement initiatives.
- Interpreting SPC charts by learning the rules for identifying special causes, recognizing patterns and signals, using zone analysis, and reacting appropriately to common and special cause variations.
- Implementing SPC charts through a step-by-step process, leveraging software tools like Minitab and QI Macros, and exploring real-world case studies and examples.
- Delving into advanced SPC concepts, such as multivariate SPC, short-run SPC, and integrating SPC with Six Sigma DMAIC methodology.
- Addressing limitations and challenges, including data requirements, mistaking special causes, process parameter changes, and human factors.
- Exploring best practices for periodic review, integrating SPC into quality management systems, and employee training, and combining SPC with other quality tools like FMEA and DOE.
- Glimpsing the future of SPC charts, including the impact of Industry 4.0, IIoT, software advancements, automated data collection, and integration with AI/Machine Learning.
Introduction to SPC (Statistical Process Control) Charts
It’s important to understand Statistical Process Control (SPC) charts, what they are, and their impact on quality and process improvement initiatives.
SPC charts, also known as control charts or Shewhart charts, are powerful graphical tools that enable us to study how a process changes over time.
What are SPC Charts?
At their core, SPC charts are line graphs that plot data points in chronological order, typically with the measurement or metric on the vertical (y) axis and time or observation number on the horizontal (x) axis.
However, what sets them apart is the inclusion of statistically calculated lines: a central line (CL) representing the average or mean, an upper control limit (UCL), and a lower control limit (LCL).
These control limits are derived from the process data itself, providing a visual representation of the expected range of variation.
History and Evolution of SPC Charts
The origins of SPC charts can be traced back to the pioneering work of Walter A. Shewhart at Bell Laboratories in the 1920s.
Shewhart’s groundbreaking contributions laid the foundation for the modern understanding of process control and variation.
It was later during the pivotal post-World War II era that W. Edwards Deming, often referred to as the “Father of Quality Management”, introduced and popularized the use of SPC charts in Japanese industries, sparking a quality revolution that transformed manufacturing globally.
Importance of SPC Charts
SPC charts have become indispensable tools in the pursuit of product quality and process capability.
By monitoring and analyzing data over time, these charts enable organizations to distinguish between two distinct types of variation:
- Common cause variation: This is inherent to any process and results in a stable, predictable pattern.
- Special cause variation: This signals the presence of assignable causes that require investigation and corrective action.
Leveraging SPC charts empowers organizations to detect process instability, identify patterns and trends, assess process capability, and drive continuous improvement efforts.
Explore how SPC charts fit into a broader quality improvement framework. Lean Six Sigma Overview course introduces you to a comprehensive toolkit for driving quality and efficiency.
By proactively addressing issues and optimizing processes, companies can enhance product quality, increase customer satisfaction, and improve operational efficiency, ultimately gaining a competitive edge in their respective markets.
Fundamentals of SPC Charts
Before delving into the practical applications of SPC charts, it’s crucial to understand the fundamental concepts that underpin their effectiveness.
Common Cause vs. Special Cause Variation
In any process, variation is inevitable. However, not all variation is created equal. SPC charts are designed to differentiate between two types of variation: common cause variation and special cause variation.
Common cause variation, also known as natural process variation, is the inherent variation present in a process due to various random factors, such as minor fluctuations in materials, environmental conditions, or operator differences.
This type of variation is expected and can be predicted based on historical data. It results in a stable, predictable pattern within the control limits.
On the other hand, special cause variation is the result of assignable causes, often referred to as “out-of-control” conditions.
These causes can be attributed to specific events, such as equipment failures, changes in raw materials, operator errors, or other identifiable factors.
Special cause variation leads to unpredictable patterns and data points falling outside the control limits, indicating that the process is unstable and requires investigation and corrective action.
Components of an SPC Chart
Every SPC chart consists of three essential components: the centerline (CL), the upper control limit (UCL), and the lower control limit (LCL).
The centerline, typically represented by a solid horizontal line, depicts the average or mean value of the process characteristic being monitored. It serves as a reference point for comparing current process performance.
The upper control limit (UCL) and lower control limit (LCL) are statistically calculated boundaries that define the expected range of variation for the process when it is in a state of statistical control.
These limits are typically set at three standard deviations above and below the centerline, respectively.
Data points falling within these limits are considered part of the common cause variation and are expected within the normal operating conditions of the process.
Types of SPC Charts
SPC charts can be broadly categorized into two main types: charts for variables data and charts for attribute data.
Variables Data SPC Charts
Variables data charts are used when the quality characteristic being measured is a continuous variable, such as weight, length, or temperature.
These charts are further divided into several subcategories:
X-bar and R Charts
X-bar and R charts are used when dealing with subgroup data, where multiple samples or measurements are taken at each time.
The X-bar chart monitors the average (mean) of the subgroup averages, while the R chart tracks the range (difference between the highest and lowest values) within each subgroup.
X-bar and S Charts
Similar to X-bar and R charts, X-bar and S charts are used for subgroup data.
However, instead of the range, the S chart monitors the standard deviation within each subgroup, providing a different measure of process variation.
Individual and Moving Range (I-MR) Charts
When dealing with individual observations or measurements, rather than subgroups, the Individual and Moving Range (I-MR) charts are utilized.
The I chart plots the individual data points, while the MR chart tracks the moving range between consecutive observations, providing a measure of short-term variation.
Attribute Data SPC Charts
Attribute data charts are used when the quality characteristic being measured is based on a count or classification, rather than a continuous variable.
These charts include:
P Chart (Percent Defective)
The P chart is used to monitor the proportion or percentage of defective items in a sample or subgroup. It is particularly useful when dealing with defects or non-conformities in a process.
NP Chart (Number Defective)
Similar to the P chart, the NP chart tracks the number of defective items in a sample or subgroup. It is often used when the sample size varies, making it more appropriate than the P chart in certain situations.
C Chart (Count Defects)
The C chart is used to monitor the number of defects or non-conformities in a given unit, such as the number of scratches on a product surface or the number of errors in a software program.
U Chart (Defects per Unit)
The U chart, also known as the defects per unit chart, is used to track the average number of defects per unit or product.
It provides a way to monitor the overall quality level of a process by considering the defect rate per unit rather than the total number of defects.
Choosing the appropriate SPC chart type is crucial for accurately monitoring and analyzing the process data, as each chart is designed to handle specific types of quality characteristics and data structures.
When to Use SPC Charts
SPC charts are versatile tools that can be applied in a wide range of scenarios across various industries and processes.
However, understanding when to leverage these charts is essential for maximizing their effectiveness and driving meaningful improvements.
Monitoring Process Performance Over Time
One of the primary applications of SPC charts is monitoring process performance over an extended period.
By plotting data points chronologically, these charts provide a visual representation of how a process evolves and changes over time.
This capability enables organizations to identify trends, shifts, and patterns that may not be immediately apparent through other means.
Detecting Process Instability
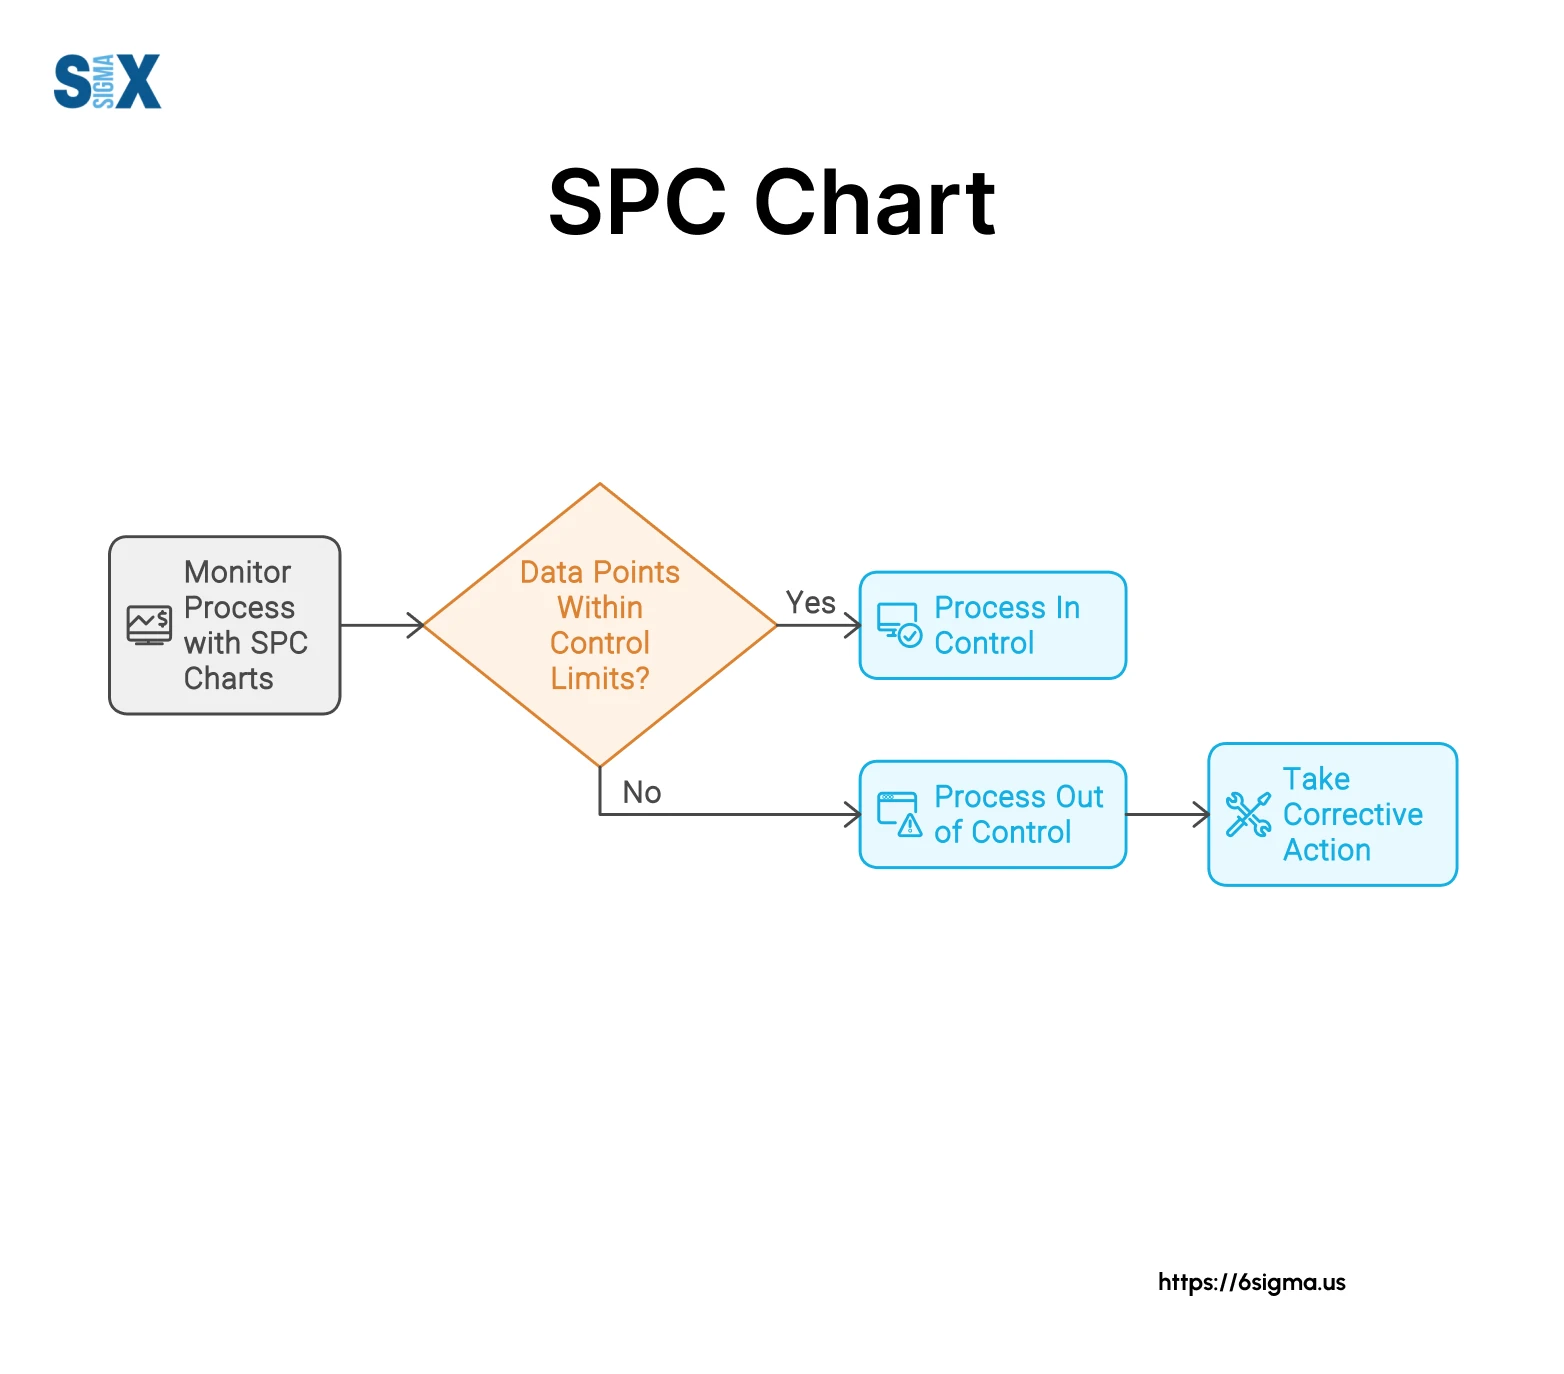
Another crucial application of SPC charts is detecting process instability, which is characterized by the presence of special cause variation.
When data points fall outside the control limits or exhibit specific patterns (e.g., runs, trends, or hugging the control limits), it indicates that the process is no longer operating under a state of statistical control.
These out-of-control conditions, often referred to as signals, suggest that assignable causes are influencing the process, and investigation is warranted to identify and eliminate these root causes.
Assessing Process Capability
In addition to monitoring process performance and stability, SPC charts play a vital role in assessing process capability.
Process capability indices, such as Cp and Cpk, are statistical measures that quantify the ability of a process to meet specified tolerances or specifications.
By analyzing the control limits and process data on an SPC chart, organizations can determine whether a process is capable of producing outputs within the desired specifications consistently.
This information is crucial for making informed decisions about process improvements, setting realistic targets, and ensuring that customer requirements are met.
Driving Continuous Improvement
SPC charts are not merely diagnostic tools; they also catalyze driving continuous improvement initiatives within organizations.
By identifying areas of concern, pinpointing root causes, and quantifying process performance, SPC charts provide valuable insights that can guide improvement efforts.
For instance, if an SPC chart reveals a persistent trend or pattern indicative of special cause variation, organizations can implement targeted corrective actions or process modifications to address the underlying issues.
Conversely, if the process exhibits stable performance but fails to meet desired specifications, more comprehensive improvements or redesigns may be necessary.
Interpreting SPC Charts
While SPC charts provide a powerful visual representation of process data, interpreting them correctly is essential for extracting meaningful insights and taking appropriate actions.
Rules for Detecting Special Causes
One of the primary objectives of SPC charts is to identify special causes of variation, which indicate that a process is out of statistical control.
Several rules, collectively known as the Western Electric rules or Nelson rules, have been established to detect these special causes.
Some of the most commonly used rules include:
- One or more points beyond the control limits
- Two out of three consecutive points outside the two-sigma limits (but still within the control limits)
- Four out of five consecutive points beyond the one-sigma limits (but still within the control limits)
- A run of eight or more consecutive points on the same side of the centerline
These rules are designed to recognize patterns and signals that are unlikely to occur due to common cause variation alone, indicating the presence of assignable causes that require further investigation and corrective action.
Identifying Patterns and Signals
In addition to the Western Electric rules, interpreting SPC charts involves recognizing specific patterns and signals that may not necessarily violate the control limits but still warrant attention.
These patterns can provide valuable insights into the underlying process dynamics and potential areas for improvement.
Common patterns to look for include:
- Runs: A sequence of points on the same side of the centerline, indicating a potential trend or shift in the process.
- Trends: A series of points consistently increasing or decreasing over time, suggesting a gradual change in process conditions.
- Hugging the control limits: Points clustering near or alternating around one of the control limits, which may indicate a lack of process centering or potential instability.
Identifying these patterns can help organizations anticipate potential issues and take preventive measures before they escalate into more significant problems.
Using Zones for Sensitivity Analysis
To enhance the sensitivity of SPC chart interpretation, the control region between the upper and lower control limits can be divided into zones.
This zoning approach provides additional context and nuance when analyzing process performance.
Typically, the region is divided into three zones:
- Zone A: The area closest to the control limits, often considered a warning zone.
- Zone B: The intermediate area between Zone A and the centerline.
- Zone C: The area closest to the centerline, representing the most desirable process performance.
Dive deeper into creating and analyzing SPC charts. Introduction to Graphical Analysis with Minitab course offers practical training in these essential skills.
By monitoring the distribution of data points across these zones, organizations can gain insights into the process stability and identify potential areas for improvement, even if the control limits are not violated.
Future of SPC Charts
As the focus shifts ahead, emerging industries and techniques will steer quality observation’s steady evolution.
Industry 4.0‘s interconnected systems and live data exchanges plus real-time data influx from networked tools are fast becoming the norm.
Such connectedness grants previously impossible visibility into workflow motions.
Software progresses apace to satisfy organizations’ adaptive needs. Automated data collection and analysis too becomes a reality through proliferating sensors, smart tools, and cloud-supported insights.
Artificial intelligence and machine learning emerge as trusted partners, enhancing preprocessing, pattern finding, foresight, and decision aids.
Integrating such advancements strategically multiplies competitive advantage. Unparalleled process fluency, quality, and client fulfillment results for observant pioneers.
Quality enhancement proves Journey, not destination. May discoveries brighten each stride together – and tools like SPC charts remain, loyal companions, wherever performance matters deeply.
Progress springs from shared sights magnifying Nature’s patterns for reliable insights and betterments through challenges overcome as one.
Lead quality improvement initiatives using SPC charts and other advanced techniques. Lean Six Sigma Green Belt course prepares you to implement and manage complex improvement projects.
SixSigma.us offers both Live Virtual classes as well as Online Self-Paced training. Most option includes access to the same great Master Black Belt instructors that teach our World Class in-person sessions. Sign-up today!
Virtual Classroom Training Programs Self-Paced Online Training Programs


