Platykurtic Distribution: Definition, Analysis & Applications
Platykurtic distribution is a statistical distribution characterized by its thinner tails compared to a normal distribution. This means it has fewer extreme values or outliers.
They are uniquely useful for certain applications, especially those involving extreme events or outliers.
Key Highlights
- Definition and main features of platykurtic distribution
- How to identify platykurtic distributions using kurtosis and shape analysis
- Examples of platykurtic distributions
- Advantages for capturing extreme events and robustness against outliers
- Limitations around reduced information and non-normal shape
- Methods for analyzing data and assessing platykurtic fit
- Comparisons with normal, leptokurtic, and other distributions
- Overview of key parameters
- Applications for modeling rare events in finance, insurance, and more
- Techniques for reducing the influence of outliers
- Approaches for statistical analysis and data visualization
- Discussion of sources of error and advanced statistical methods
What is a Platykurtic Distribution?
A platykurtic distribution refers to a type of statistical distribution exhibiting negative excess kurtosis.
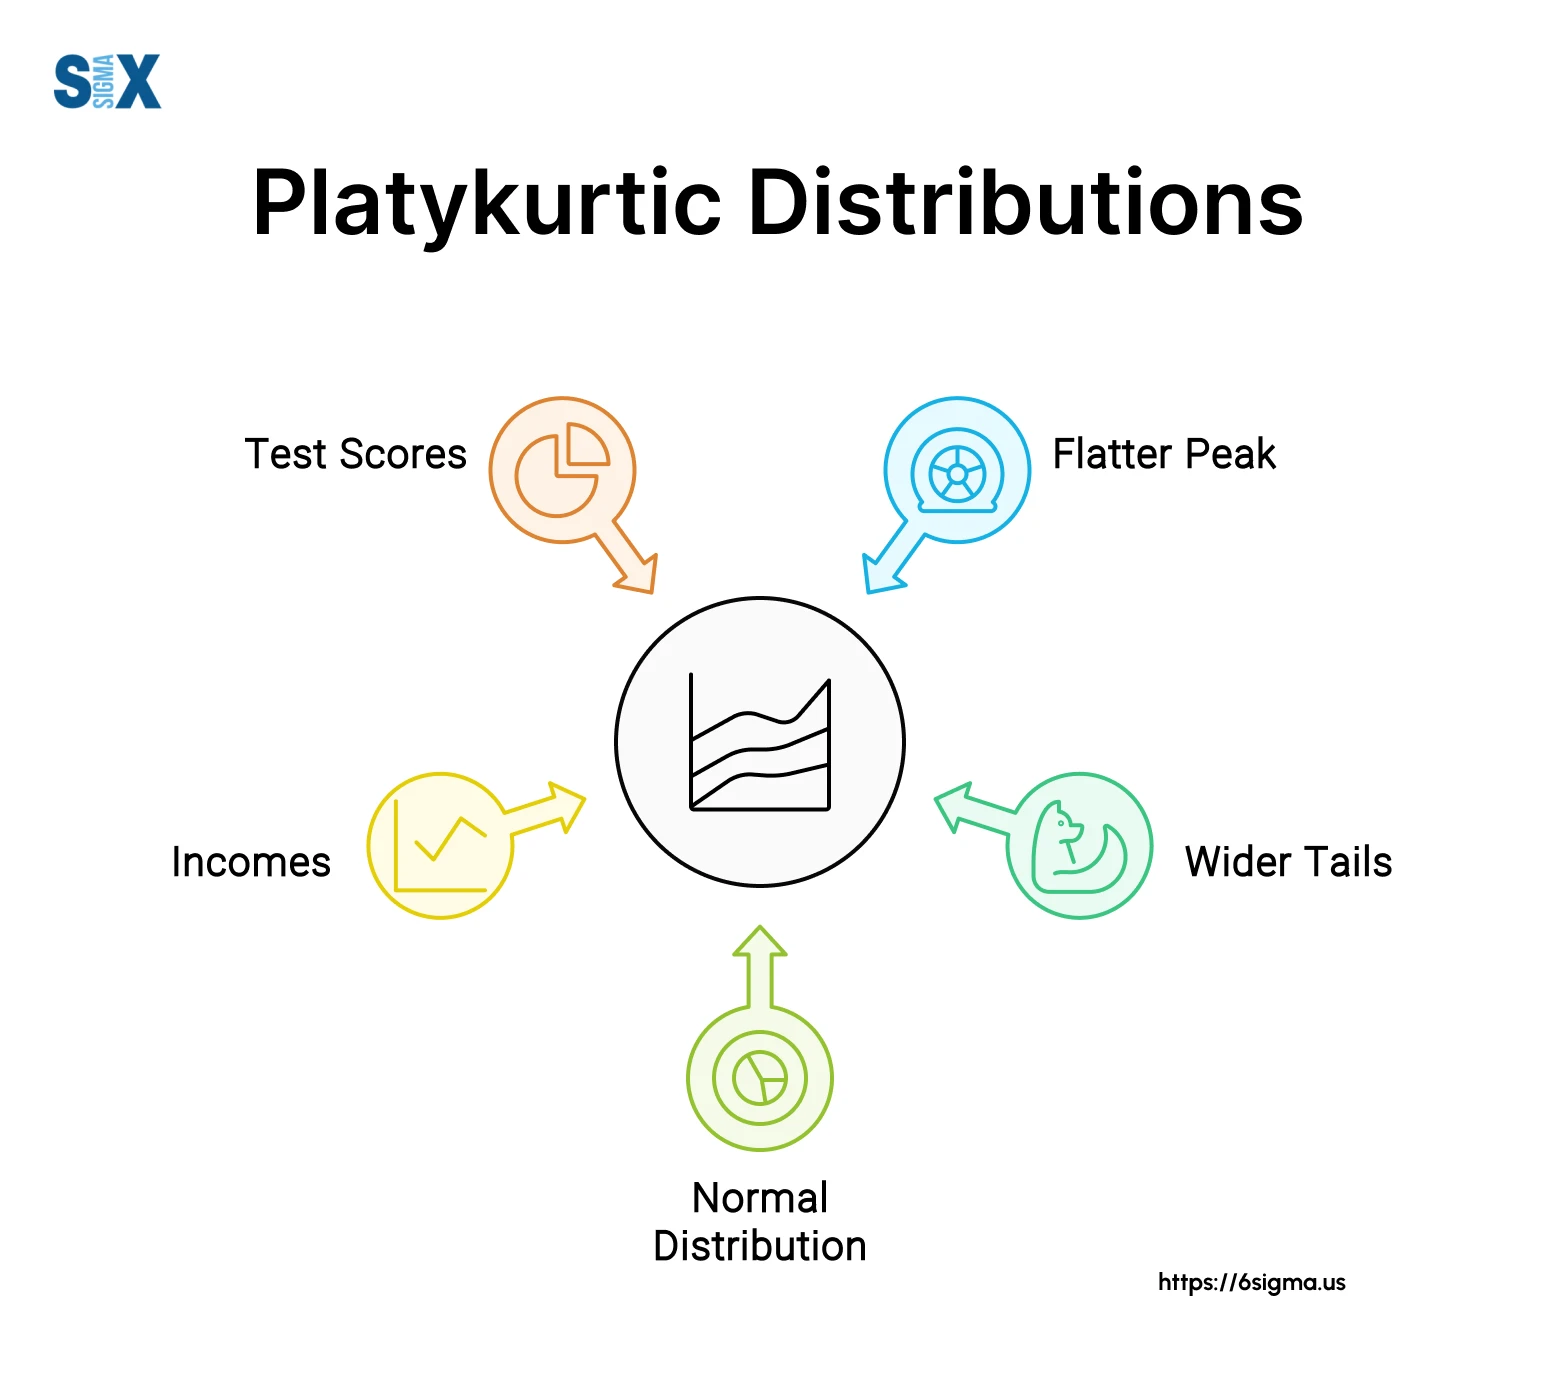
In simpler terms, it demonstrates shorter, fatter tails and a wider, flatter peak compared to a standard normal distribution.
This characteristic shape limits outliers and instead concentrates data more closely around the central tendency.
Definition
The formal definition describes a platykurtic distribution as having a kurtosis less than 3, often lower than 0.
This quantifies the reduced propensity for variability outside a shortened range encompassing the bulk of values.
Excess kurtosis specifically measures deviation from the benchmark normal distribution’s kurtosis value of 3.
Key Characteristics of Platykurtic Distribution
Flatter Peak
Rather than forming a sharp apex like the typical bell curve, data clustering near the center of a platykurtic distribution fans out to produce a wide plateau.
The concentration around the high point appears alleviated.
Shorter, Fatter Tails
While long, slender tails represent the norm, the abbreviated tails of platykurtic distribution are also thicker, like a bird with a stubby wing shape rather than streamlined feathers.
Lower Kurtosis Value
As mentioned, the key parameter delineating platykurtic status is a kurtosis statistic lower than mesokurtic distributions, i.e. less than 3, often substantially negative.
This mathematical marker encodes the distinctive geometry.
May Exhibit Skewness
Skewness describes asymmetry whereby one tail of a distribution extends farther than the other from the central tendency measure.
Platykurtic distribution frequently demonstrate skewed non-normality along with kurtosis deviation.
Difference from Normal Distribution
Normal distributions constitute a special class within statistical distributions, permitting broader analytical application.
Discrepant kurtosis, skewness and density clustering differentiate platykurtic distribution.
Identifying a Platykurtic Distribution
Kurtosis Value
Mathematically confirming platykurtosis relies chiefly on calculating a sample’s kurtosis value and observing it falls below the normal distribution benchmark of around 3, preferably into negative territory.
Distribution Shape
Before completing numerical computations, one can visually inspect distribution graphs for signs of platykurtic tendencies – namely the reduced, widened peak and abbreviated tail shape.
Flatter Peak
Comparing histograms or density plots will showcase the lowered peak plateau spreading the distribution more evenly across the center than a normal distribution’s acute apex.
Shorter Tails
The defining short tails that emerge on visualizations of platykurtic data sets will conspicuously lack length compared to benchmark bell curves or previous observations.
Examples and Applications of Platykurtic Distribution
Stock Returns
In investment risk modeling, accommodating the uncertainty of markets crashing relies on distributions with enough allocation of probability mass within compressed tails to account for such black swans.
The capacity to incorporate occasional epochs of extreme volatility demonstrates a key advantage of conceptualizing market dynamics through a platykurtic lens.
Biological Populations
Notably lifespan and size attributes within species often yield platykurtic distribution as very high and low extremes occur more frequently than a Gaussian model would stipulate.
Once again, the greater incorporative flexibility for fluctuations counterbalances thinner overall data density.
Extreme Events Identifying using Platykurtic Distribution
Mathematical descriptions of flooding, outsized insurance claims from catastrophes and other outliers generally utilize or even derive from platykurtic distribution that essentially allocate greater likelihood of outliers emerging while concentrating values toward centralized tendencies.
Outliers
Given decreased sway of outliers within shortened, tapered tails, datasets particularly prone to producing outliers may exhibit concomitant platykurtosis alongside lowered kurtosis metrics.
These distributions naturally curb errant influence.
Advantages of Platykurtic Distribution
Capturing Extreme Events with Platykurtic Distribution
By incorporating robust probability weight in the dense, abbreviated tails, platykurtic profiles efficiently account for sporadic yet impactful bursts of extreme observations like market shocks or climate superlatives.
Robust to Outliers
Concentrating density surrounding central tendencies within platykurtic distributions intrinsically limits capacity for outliers to skew or distort overall distribution shape, useful for volatile data.
Limitations and Considerations of Platykurtic Distribution
Reduced Information
The compressed, flattened geometry of peaks and tails consolidates variability into a narrower band, reducing information content available for analysis and inference compared to an equivalent normal distribution.
Non-Normal Shape
Divergence from the textbook normal distribution form underpins defining platykurtosis but limits wider application of analytical methods assuming normality. Reformatting data could counteract this issue.
Analyzing Data for Platykurtosis
Graph Shape
The archetypal shape immediately signals possibility of platykurtic structure, facilitating visual identification by comparing against normal distribution overlays.
Calculate Kurtosis
Mathematically certifying platykurtosis requires directly calculating the kurtosis statistic, broadly available across software platforms. The key threshold falls below a kurtosis metric of 3 and strongly negative values seal certainty.
Apply Transformations with Platykurtic Distribution
Transforming data according to functions like Box-Cox formulations can reposition distribution parameters like peakedness and tail length to align more closely with normality assumptions underlying certain analytical procedures.
Comparing Other Distributions with Platykurtic Distribution
Normal Distribution
By definition normal distributions exhibit kurtosis tightly centered on 3, unlike the marked negative deviation toward 0 or below characteristic of platykurtic data.
The skinny tails and sharp apex offer further contrast.
Leptokurtic Distribution
Where platykurtic geometry concentrates magnitude reduction to the peak and tails, leptokurtic distributions instead intensify these aspects.
This manifests as exceptionally pointy distribution peaks and massively elongated, slender tails relative to normal distributions. High positive excess kurtosis mathematical codifies this.
Mesokurtic Distribution
The mesokurtic designation signifies a distribution abiding roughly by the conventional normal distribution shape and kurtosis value near 3.
So while platykurtosis involves too little kurtosis, mesokurtic data conforms to baseline expectations.
Properties and Parameters of Platykurtic Distribution
Peak Shape
Embodying the namesake of its platy- prefix, the distinguishing summit shape spreads flat, wide and low where other distributions might rise to an acute tip.
Density appears more evenly arrayed across the center instead of narrowing toward a high vertex.
Tail Shape
Opposite the abbreviated, thickened tails sitting beneath a platykurtic distribution’s modest apex, true normality corresponds with elongated, tapered tails housing lower density outskirts.
These barely register compared to the proportionally substantial yet compacted platykurtic tails.
Kurtosis Measure
The kurtosis coefficient mathematically encodes the extent of peakedness and tail weight differentiating platykurtic data from canonical standards around a kurtosis of 3.
Conventionally the comparative value dips below zero indicating highly attenuated parameters.
Skewness Measure
Documenting asymmetry whereby the spread departs more steeply in one direction, skewness coefficients supplement kurtosis statistics in quantifying distribution deviation.
Most platykurtic data incorporates some unequal skewing.
Modeling Rare Events with Platykurtic Distribution
Finance and Investing
Investments in developed markets are riskier than what traditional models predict.
These markets often experience sudden and extreme ups and downs (booms and crashes) that are not accounted for in the usual, simpler models.
Insurance Risk with Platykurtic Distribution
Projecting coverage liabilities relies upon predicting major storm, flood and disaster damages credibly ensuing with some measurable likelihood for the extreme events occupying distributional slender tails.
Orienting models toward platykurtosis allows insurers to guard against severely underestimating catastrophic event risk.
Handling Outliers
Reduce Influence of Outliers with Platykurtic Distribution
By determining boundaries conservatively nearer to the central clump of observations and allocating less density across lengthy gaussian tails, platykurtic distributions minimize the impact outliers could do on model accuracy.
Statistical Analysis
Parameter Estimation with Platykurtic Distribution
Deriving granular estimates for distribution parameters depends deeply on incorporating information across the entire observable range.
The scarcity within abbreviated platykurtic tails hinders precision compared to replete gaussian forms.
Distribution Fitting
If data doesn’t follow a normal pattern (it’s “platykurtic”), simple analysis methods might not work well. To fix this, we can adjust the data to look more normal before analyzing it.
Essentially, the data needs to be reshaped to fit the standard methods.
Data Visualization using Platykurtic Distribution
Histograms
Clarity emerges from visualizing histogram data and noting the lowered center and almost bitten-short tails characteristic of playkurtic densities not mounting gaussian asymptotes.
Density Plots
Unlike histograms segmented by bounded bins, kernel density traces enable perceiving the continuous fluctuation toward a platykurtic distribution’s rounded crest and rapid tapering through its compacted tails.
Sources of Error and Bias
Insufficient centrality and outliers, poor parameter initialization for fitting procedures, skewed sampling, spurious simulation assumptions could all conceivably introduce distortions within platykurtosis analysis.
Advanced Concepts and Methods under Platykurtic Distribution
Mixture Models
Summing multiple distinct constituent distributions according to precise proportions can produce an emergent combined distribution exuding platykurtic qualities suitable for modeling complex composite data.
Bootstrapping with Platykurtic Distribution
By repeatedly resampling data to validate model stability and generalizability, bootstrapping constitutes a foundational technique for confirming or denying potentially spurious platykurtic artifacts stemming from unique samples vulnerable to idiosyncrasies.
Simulation
In absence of abundant observations for some domains like insurance catastrophe risk projections, simulating theoretical outcomes grounded in platykurtic principles forms a defensible substitute permitting investigation of environmental extremes.
Future Research Directions of Platykurtic Distribution
Platykurtic distribution represent a fascinating and often underappreciated aspect of statistical analysis.
With their flatter peaks, shorter tails, and unique properties, these distributions offer valuable insights across various fields, from finance to biology.
It’s important to remember that while platykurtic distributions have their advantages, such as better capturing certain types of extreme events and showing robustness against outliers, they also come with limitations.
The reduced information content and departure from normality can pose challenges in traditional statistical approaches.
Looking ahead, the field of platykurtic distribution analysis is ripe for further research and development.
From refining parameter estimation methods to exploring new applications in emerging fields, there’s still much to discover.
SixSigma.us offers both Live Virtual classes as well as Online Self-Paced training. Most option includes access to the same great Master Black Belt instructors that teach our World Class in-person sessions. Sign-up today!
Virtual Classroom Training Programs Self-Paced Online Training Programs


