One Way ANOVA: Statistical Testing Made Simple
Statistical analysis forms the backbone of data-driven decision-making across industries.
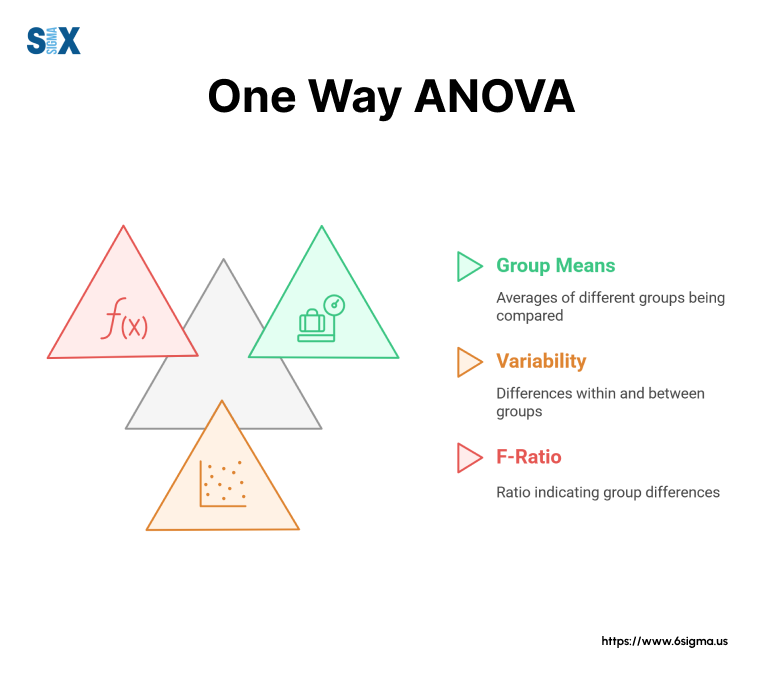
One Way ANOVA stands as a crucial statistical test that helps researchers and analysts determine whether significant differences exist between multiple group means.
This method proves particularly valuable when comparing three or more groups simultaneously, offering deeper insights than traditional t-tests.
Key Highlights
- Calculate and interpret ANOVA test results
- Apply statistical assumptions correctly
- Make data-driven decisions using ANOVA
- Navigate common software tools for analysis
What Is One Way ANOVA?
One Way ANOVA represents a statistical method that examines whether significant differences exist between the means of three or more independent groups.
This technique extends beyond simple two-group comparisons, allowing researchers to analyze multiple groups simultaneously while maintaining statistical accuracy.
Purpose And Statistical Framework
The primary function of One Way ANOVA centers on testing the null hypothesis that all group means are equal.
By analyzing variance both between and within groups, this test determines whether observed differences occur by chance or represent genuine statistical differences.
Consider a pharmaceutical study comparing three different drug dosages.
Rather than conducting multiple t-tests, which increases error risk, One Way ANOVA provides a single, reliable analysis to determine if any dosage produces significantly different results.
When To Use One Way ANOVA
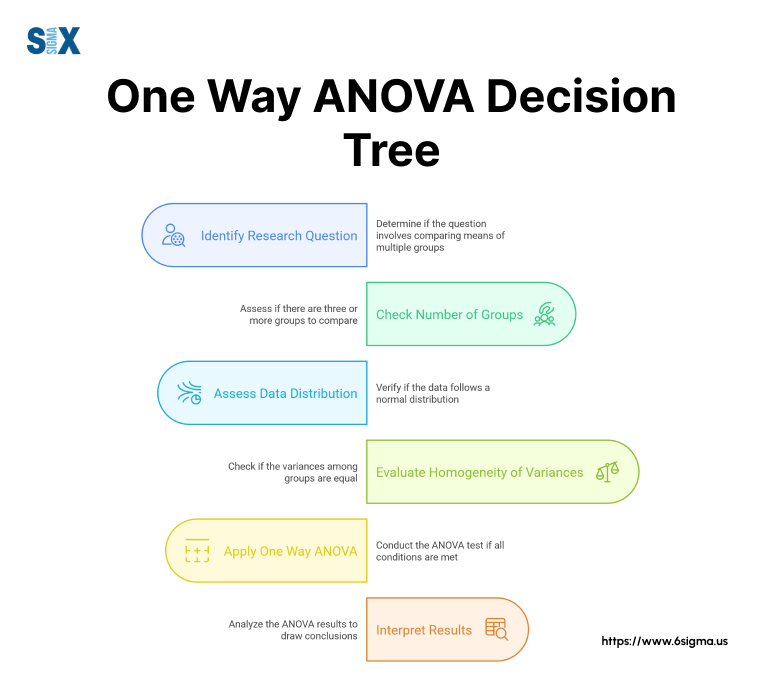
Researchers should employ One Way ANOVA when:
- The study involves one independent variable with three or more levels
- The dependent variable shows continuous measurement
- Groups maintain independence from each other
- Data meets the required statistical assumptions
For example, a manufacturing company might use One Way ANOVA to evaluate production output across different shifts, or educational researchers might compare test scores across multiple teaching methods.
Applications Across Fields
The versatility of One Way ANOVA extends across numerous professional domains. Business analysts use it to compare sales performance across regions.
Medical researchers employ it to evaluate treatment effectiveness. Quality control specialists apply it to assess product consistency across manufacturing lines.
This statistical tool proves particularly valuable when dealing with real-world scenarios that involve multiple comparison groups.
By providing a structured approach to group comparison, One Way ANOVA helps professionals make data-driven decisions while controlling for statistical errors.
Master Statistical Analysis with Confidence and Transform complex data into clear, actionable information
Key Assumptions Of One Way ANOVA
Before conducting a One Way ANOVA test, researchers must verify several statistical assumptions to ensure valid results.
These assumptions form the foundation for reliable statistical analysis and meaningful conclusions.
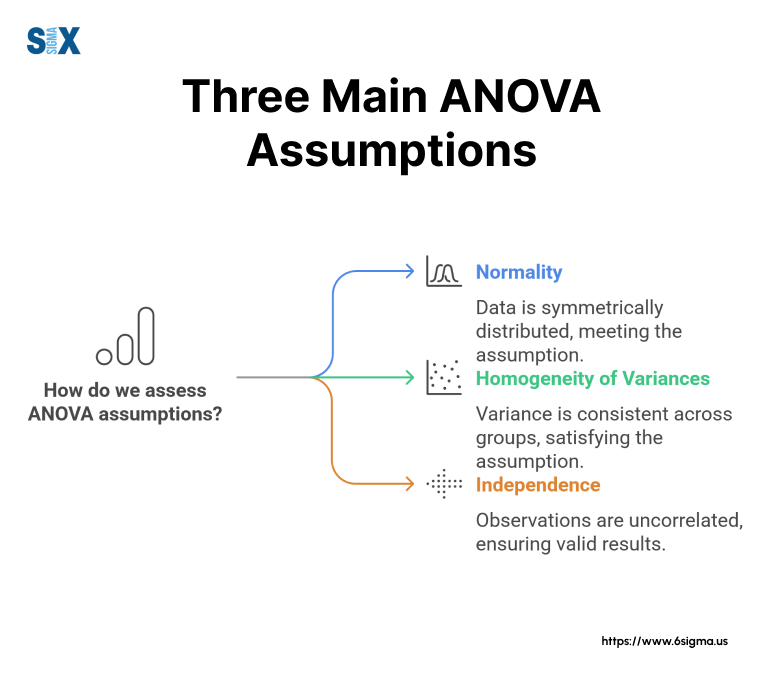
Normal Distribution Of Data
The data within each group should follow a normal distribution pattern. This means the data points cluster around the mean in a bell-shaped curve.
Researchers can verify normality through:
- Visual inspection of histograms
- Q-Q plots examination
- Shapiro-Wilk test results
Minor violations of normality might not significantly impact the results, especially with larger sample sizes. However, severe deviations may require alternative non-parametric tests.
Independence Of Observations
Each data point must remain independent of other observations. This means the value of one observation should not influence or relate to any other observation in the dataset.
For example, in a manufacturing study, measurements from one production batch should not affect measurements from another batch.
Homogeneity Of Variance
The variance within each group should remain approximately equal. Statisticians often use Levene’s test to verify this assumption.
When groups show significantly different variances, the One Way ANOVA test might produce unreliable results.
If data violates these assumptions, researchers should consider:
- Data transformation techniques
- Non-parametric alternatives like Kruskal-Wallis test
- Welch’s ANOVA for unequal variances
Meeting these assumptions ensures the One Way ANOVA test produces trustworthy results that lead to valid statistical conclusions.
Regular verification of these conditions should become standard practice in any statistical analysis workflow.
Step-By-Step Guide To Performing One Way ANOVA
Executing a One Way ANOVA requires careful planning and systematic implementation.
The process begins with proper hypothesis formulation, which sets the foundation for the entire analysis.
Setting Up Your Hypothesis
The hypothesis formation stage establishes what the One Way ANOVA test aims to prove or disprove. This critical step determines the direction of the analysis and shapes the interpretation of results.
Null Hypothesis (H0)
The null hypothesis states that no significant differences exist between the group means. Written mathematically:
H0: μ1 = μ2 = μ3 = … = μk
Where μ represents the population mean of each group, and k represents the number of groups.
For example, in a study comparing three teaching methods, the null hypothesis would state that all methods produce equal student performance.
Alternative Hypothesis (Ha)
The alternative hypothesis states that at least one group mean differs significantly from the others. Mathematically expressed:
Ha: At least one μi ≠ μj (where i ≠ j)
This hypothesis suggests that real differences exist between at least two groups in the study.
Using the teaching methods example, the alternative hypothesis would indicate that at least one method produces different results from the others.
Practical Implementation
When formulating hypotheses, researchers should:
- State hypotheses clearly and specifically
- Ensure hypotheses address the research question
- Frame hypotheses in testable terms
- Consider practical significance alongside statistical significance
The hypothesis setup directly influences:
- Selection of significance level (α)
- Determination of sample size requirements
- Choice of post-hoc tests if needed
- Final interpretation of results
Statistical software packages require proper hypothesis specification to generate accurate results.
Clear hypothesis formulation helps researchers avoid common pitfalls in One Way ANOVA implementation and ensures meaningful analysis outcomes.
Calculating One Way ANOVA
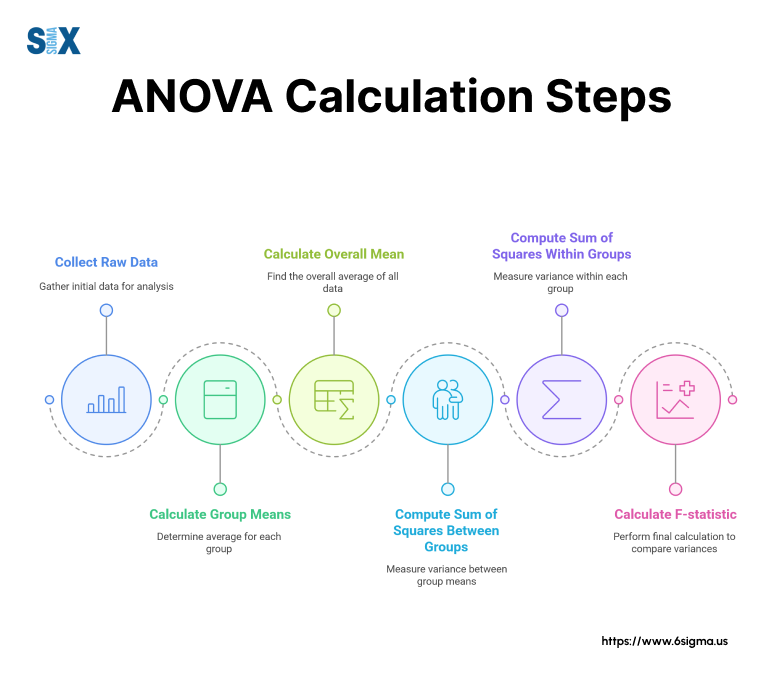
The One Way ANOVA calculation process involves several sequential steps that transform raw data into meaningful statistical results.
Each component builds upon the previous calculations to reach the final F-statistic.
Sum Of Squares Components
The calculation begins with three essential sum of squares measurements:
Total Sum of Squares (SST):
SST = Σ(x – x̄)²
Where x represents individual values and x̄ represents the grand mean.
Between-Groups Sum of Squares (SSB):
SSB = Σni(x̄i – x̄)²
Where ni represents group size and x̄i represents group means.
Within-Groups Sum of Squares (SSW):
SSW = SST – SSB
Degrees Of Freedom
Three degrees of freedom values guide the analysis:
- Between groups (dfb) = k – 1
- Within groups (dfw) = N – k
- Total (dft) = N – 1
Where k represents the number of groups and N represents total sample size.
Mean Square Values
Mean Square Between (MSB):
MSB = SSB/dfb
Mean Square Within (MSW):
MSW = SSW/dfw
F-Statistic Calculation
The final F-statistic emerges from the ratio:
F = MSB/MSW
This value determines whether significant differences exist between group means. A larger F-value suggests greater between-group differences relative to within-group variation.
Using Online Calculators
While manual calculations provide deep understanding, One Way ANOVA calculators streamline the process.
These tools require:
- Raw data input for each group
- Specification of significance level
- Selection of post-hoc tests if needed
The calculator generates:
- Complete ANOVA table
- F-statistic value
- P-value for hypothesis testing
- Additional statistical measures
Understanding these calculations enables researchers to interpret results accurately and identify potential errors in automated analyses.
This knowledge proves particularly valuable when explaining results to stakeholders or troubleshooting unexpected outcomes.
Interpreting One Way ANOVA Results
The interpretation of One Way ANOVA results requires careful examination of several statistical components.
Each element of the ANOVA table provides specific insights about group differences and their statistical significance.
Reading The ANOVA Table
The ANOVA table presents crucial statistical information in a structured format.
The table typically displays:
| Source of Variation | Sum of Squares | df | Mean Square | F-value | P-value |
| Between Groups | SSB | k-1 | F | P | |
| Within Groups | SSW | N-k | MSW | ||
| Total | SST | N-1 |
These values work together to tell the complete statistical story of group differences.
Understanding P-Value Results
The p-value determines statistical significance by comparing it to the predetermined alpha level (typically 0.05). Two possible outcomes emerge:
P-value < 0.05: Reject the null hypothesis, indicating significant differences exist between groups.
P-value ≥ 0.05: Fail to reject the null hypothesis, suggesting insufficient evidence for group differences.
Measuring Effect Size
Effect size calculations provide practical significance beyond statistical significance.
The most common measures include:
Eta-squared (η²) = SSB/SST
- Small effect: η² ≈ 0.01
- Medium effect: η² ≈ 0.06
- Large effect: η² ≈ 0.14
This measure helps researchers understand the magnitude of group differences, providing context for practical applications.
Practical Significance
Statistical significance must be considered alongside practical importance.
Researchers should evaluate:
- The real-world impact of observed differences
- Cost-benefit implications of findings
- Relevance to stakeholder objectives
- Limitations of the analysis
The interpretation of One Way ANOVA results guides decision-making processes and shapes recommendations for practical applications.
This understanding enables researchers to communicate findings effectively to both technical and non-technical audiences.
Software Implementation
Modern statistical software packages streamline the One Way ANOVA process, making complex calculations accessible to researchers and analysts.
Different platforms offer varying features and interfaces for conducting these analyses.
Performing One Way ANOVA In SPSS
SPSS provides a user-friendly interface for conducting One Way ANOVA analyses. The process follows a logical sequence:
- Data Organization
Navigate to Variable View and define variables appropriately. Enter data in Data View, ensuring proper coding for groups and measurements. - Analysis Selection
Click Analyze > Compare Means > One-Way ANOVA. Select the dependent variable and factor variable in the appropriate fields. - Additional Options
Access Post Hoc tests through the dedicated button. Select appropriate tests based on research needs. Enable descriptive statistics and homogeneity tests as needed.
Alternative Software Solutions
While SPSS remains popular, other statistical packages offer robust ANOVA capabilities:
R Statistical Software:
Commands like ‘aov()’ and ‘anova()’ perform analyses with additional flexibility for custom modifications.
SAS Analytics:
The PROC ANOVA procedure handles One Way ANOVA with extensive options for complex analyses.
Minitab:
Offers intuitive menu-driven interface with built-in assistant features for proper test selection.
Output Interpretation
Each software package generates standardized output including:
- ANOVA tables
- Descriptive statistics
- Test assumptions
- Post-hoc comparisons
Understanding these outputs across platforms enables researchers to verify results and ensure accurate interpretation regardless of the chosen software solution.
Supercharge Your ANOVA Calculations with Minitab
Best Practices And Tips

Successful implementation of One Way ANOVA requires attention to detail and adherence to established statistical protocols. Following these guidelines ensures reliable results and meaningful conclusions.
Data Preparation Standards
Prior to analysis, verify data quality through systematic screening. Remove outliers only when statistically justified, and document all data cleaning procedures.
Maintain original datasets separately from working files to enable result verification.
Analysis Execution
Test assumptions methodically before proceeding with One Way ANOVA calculations. When violations occur, consider appropriate alternatives or data transformations.
Document each decision point in the analysis process for transparency and replication.
Result Documentation
Record all statistical outputs, including:
- Full ANOVA tables
- Effect size calculations
- Post-hoc test results
- Assumption test outcomes
Professional Reporting
Present results following established statistical reporting standards. Include sufficient detail for independent verification while maintaining clarity for target audiences.
Address both statistical and practical significance in result interpretations.
These practices support robust statistical analysis and foster confidence in research conclusions. Regular review and updates of these procedures ensure alignment with current statistical best practices.
Moving Forward With One Way ANOVA
The One Way ANOVA test stands as a fundamental statistical tool for comparing group means and making data-driven decisions.
This method provides researchers and analysts with robust capabilities for hypothesis testing and group comparison analysis.
Success in implementing One Way ANOVA depends on proper understanding of its components, from assumption testing through result interpretation.
The systematic approach outlined in this guide establishes a foundation for conducting reliable statistical analyses across various research contexts.
Gain practical skills that drive real-world process improvements with our Green Belt BootCamp
Next Steps In Statistical Analysis
Researchers should focus on:
- Regular practice with sample datasets
- Familiarization with statistical software tools
- Application to real-world research questions
- Documentation of analysis procedures
Statistical analysis continues to evolve with new methodologies and tools. Staying current with developments in One Way ANOVA applications and related statistical techniques ensures robust research practices.
Regular review of statistical literature and participation in professional development opportunities strengthens analytical capabilities.
The journey from basic understanding to masterful application of One Way ANOVA requires dedication to statistical principles and attention to methodological details.
This investment in statistical knowledge pays dividends through improved research quality and more reliable analytical outcomes.
SixSigma.us offers both Live Virtual classes as well as Online Self-Paced training. Most option includes access to the same great Master Black Belt instructors that teach our World Class in-person sessions. Sign-up today!
Virtual Classroom Training Programs Self-Paced Online Training Programs


