Multivariate Analysis of Variance (MANOVA): Statistical Methods for Multiple Dependent Variables
Multivariate Analysis of Variance (MANOVA) serves as a powerful statistical tool for researchers analyzing multiple dependent variables simultaneously.
This advanced technique extends beyond traditional ANOVA methods, enabling scientists and analysts to uncover complex relationships in their data that might otherwise remain hidden.
Key Highlights
- Statistical foundations of MANOVA
- Implementation across research domains
- Result interpretation guidelines
- Software-based analysis techniques
What Is MANOVA And When Should You Use It?
Multivariate Analysis of Variance (MANOVA) functions as a statistical method that examines group differences across multiple dependent variables simultaneously.
This technique builds upon traditional ANOVA by incorporating the relationships between outcome measures, offering researchers a more nuanced understanding of group differences.
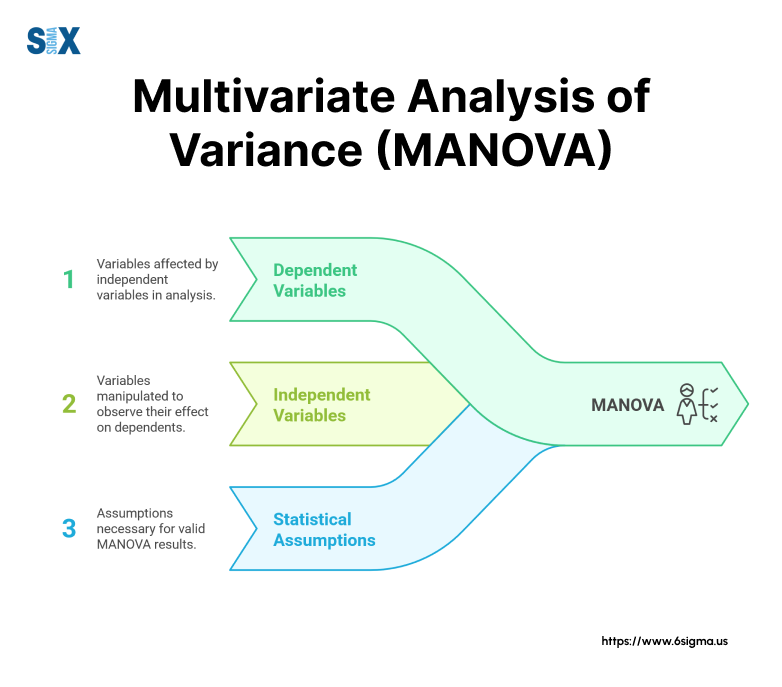
The Foundation Of Multivariate Analysis of Variance
MANOVA extends beyond simple group comparisons by analyzing how multiple dependent variables interact and vary together.
For instance, when studying educational outcomes, researchers might examine both test scores and student satisfaction ratings together, rather than analyzing each measure separately.
This unified approach captures relationships that might remain hidden in separate analyses.
The statistical power of MANOVA becomes evident when dependent variables show correlation.
Primary Applications And Benefits of Multivariate Analysis of Variance (MANOVA)
Research Design: When studying multiple related outcome measures, such as different aspects of job performance or various cognitive test scores.
Pattern Detection: For identifying group differences that manifest across combinations of variables rather than in single measures.
Error Control: By conducting one multivariate test instead of multiple univariate tests, researchers maintain better control over experiment-wise error rates.

When To Choose MANOVA
Several conditions warrant the use of Multivariate Analysis of Variance:
The research involves two or more dependent variables that share conceptual or statistical relationships. For example, analyzing multiple performance metrics in a manufacturing process.
Groups differ on a combination of outcomes rather than individual measures. Consider athletic performance where groups might differ in the combined effects of speed, strength, and endurance.
Implementation Requirements
Successful Multivariate Analysis of Variance implementation depends on meeting specific criteria:
Sample Size: Each group requires more cases than dependent variables.
Variable Relationships: Dependent variables should show moderate correlation – neither too high (redundant) nor too low (unrelated).
Data Distribution: Variables need to follow multivariate normal distribution within groups.
These requirements ensure reliable results and valid interpretations of the statistical findings.
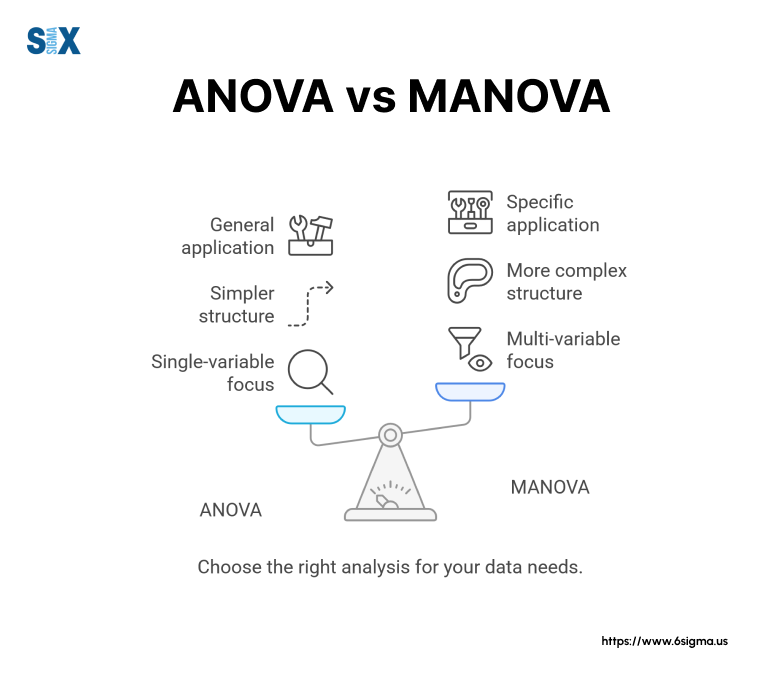
MANOVA vs. ANOVA: Understanding The Key Differences
The distinction between Multivariate Analysis of Variance (MANOVA) and Analysis of Variance (ANOVA) lies primarily in their approach to analyzing dependent variables.
Fundamental Distinctions
ANOVA focuses on measuring differences between group means for one dependent variable. For example, when analyzing student performance, ANOVA might examine only test scores.
MANOVA, however, could analyze both test scores and class participation rates simultaneously, providing insights into how these variables interact.
Statistical Power And Error Control with Multivariate Analysis of Variance
MANOVA offers superior statistical power when analyzing correlated dependent variables.
This advantage becomes particularly evident in research scenarios where outcome measures share meaningful relationships.
The method reduces the likelihood of Type I errors that might occur when conducting multiple separate ANOVA tests.
Consider a manufacturing quality control study. ANOVA might separately analyze product weight, density, and strength, potentially missing important relationships between these characteristics.
MANOVA examines these measures together, revealing patterns that individual analyses might overlook.
Choosing Between MANOVA And ANOVA
The decision between these methods depends on several factors:
Research Questions: ANOVA suits studies focusing on a single outcome measure, while MANOVA addresses questions about multiple related outcomes.
Variable Relationships: When dependent variables show moderate correlation, MANOVA provides more meaningful results than separate ANOVA tests.
Sample Size Requirements: ANOVA requires fewer participants per group, making it more practical for smaller studies.
Practical Applications And Limitations of Multivariate Analysis of Variance
MANOVA excels in specific research contexts:
- Educational Research: Analyzing multiple academic performance metrics simultaneously.
- Clinical Studies: Examining various physiological responses to treatments.
- Behavioral Research: Studying multiple aspects of participant responses.
However, MANOVA presents certain challenges:
- Interpretation Complexity: Results can be more difficult to interpret than simple ANOVA findings.
- Statistical Assumptions: MANOVA requires meeting more stringent statistical assumptions.
- Sample Size Demands: Larger sample sizes become necessary as the number of dependent variables increases.
Implementation Considerations of MANOVA
Researchers must weigh several factors when implementing either method:
- Data Structure: The nature and relationship of dependent variables.
- Research Goals: Whether examining individual or combined effects serves the study objectives.
- Resource Availability: Time, sample size, and analytical capabilities available for the study.
This understanding of the differences between MANOVA and ANOVA enables researchers to select the most appropriate method for their specific research needs, ensuring robust and meaningful results.
Essential Requirements And Assumptions For MANOVA
Multivariate Analysis of Variance (MANOVA) requires specific conditions and assumptions to produce valid results.
Sample Size Requirements
The sample size requirements for MANOVA exceed those of simpler statistical tests. Each group must contain more cases than the number of dependent variables being analyzed.
The recommended minimum follows a simple formula: N > (p + m), where N represents the sample size per group, p indicates the number of dependent variables, and m denotes the number of groups.
However, larger sample sizes improve statistical power and result reliability.
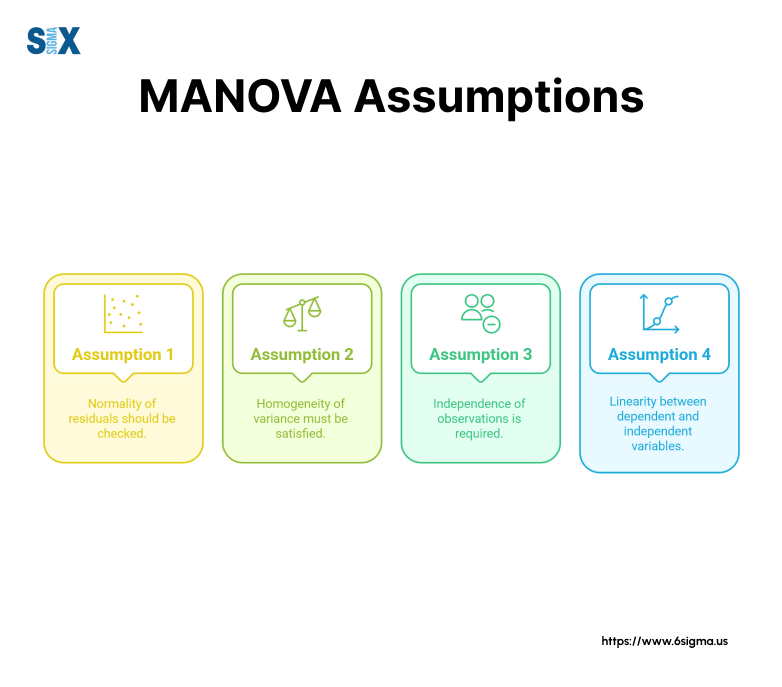
Statistical Assumptions of Multivariate Analysis of Variance (MANOVA)
MANOVA relies on several key statistical assumptions:
Multivariate Normality: Each dependent variable must follow a normal distribution within groups. Researchers test this using Mardia’s test or Q-Q plots.
Homogeneity of Variance-Covariance Matrices: The relationship between dependent variables remains consistent across groups. Box’s M test evaluates this assumption.
Linear Relationships: Dependent variables should show linear relationships with each other. Scatter plots help visualize these relationships.
Independence of Observations: Each observation must be independent of others in the dataset.
Data Preparation And Screening
Proper data preparation ensures reliable MANOVA results. This process involves several critical steps:
Missing Data Management: Researchers must address missing values through appropriate methods such as multiple imputation or listwise deletion.
Outlier Detection: Identifying and handling outliers prevents their undue influence on results. Mahalanobis distance often serves this purpose in multivariate analysis.
Variable Scaling: Dependent variables should use comparable scales to prevent any single variable from dominating the analysis.
Testing And Verification Procedures of Multivariate Analysis of Variance (MANOVA)
Several statistical tests verify MANOVA assumptions:
Shapiro-Wilk Test: Examines univariate normality for each dependent variable.
Levene’s Test: Assesses homogeneity of variance for individual variables.
Correlation Analysis: Evaluates relationships between dependent variables, ensuring they’re neither too high (multicollinearity) nor too low (independence).
Handling Assumption Violations
When data violates MANOVA assumptions, researchers have several options:
Data Transformation: Applying appropriate transformations might resolve normality or linearity issues.
Alternative Methods: Using robust statistical techniques or non-parametric alternatives when assumptions cannot be met.
Sample Size Adjustment: Increasing sample size can help overcome minor assumption violations.
Regular verification of these assumptions throughout the analysis process maintains statistical integrity and research quality.
Step-By-Step Guide To Performing MANOVA
Conducting Multivariate Analysis of Variance (MANOVA) requires careful attention to data preparation, software implementation, and result interpretation.
Data Preparation And Organization
The initial phase focuses on structuring data appropriately for analysis. Each dependent variable should occupy separate columns, with grouping variables clearly identified.
Missing values require attention through appropriate handling methods such as multiple imputation or case deletion.
Software Selection And Setup of Multivariate Analysis of Variance
Popular statistical packages for MANOVA include SPSS, R, and SAS.
Each offers distinct advantages:
- SPSS provides user-friendly interfaces and automated assumption testing.
- R offers flexibility and customization through various packages.
- SAS delivers robust handling of large datasets and advanced options.
Analysis Implementation Process
The MANOVA procedure follows these sequential steps:
Variable Definition: Specify dependent variables and fixed factors in the selected software.
Assumption Testing: Run preliminary tests for multivariate normality and homogeneity of variance-covariance matrices.
Model Specification: Select appropriate test statistics (Wilks’ Lambda, Pillai’s Trace) and post-hoc procedures.
Executing The Analysis wtih Multivariate Analysis of Variance
During analysis execution, researchers should:
Monitor Warning Messages: Address any software warnings about assumption violations or computational issues.
Save Output Files: Maintain detailed records of all statistical output for reporting and verification.
Generate Diagnostic Plots: Create visual representations to assess model fit and assumptions.
Results Interpretation Strategy of Multivariate Analysis of Variance
MANOVA interpretation proceeds through several levels:
Overall Multivariate Effects: Examine multivariate test statistics to determine significant group differences.
Univariate Follow-up: Analyze individual dependent variables when multivariate tests show significance.
Effect Sizes: Calculate and interpret appropriate effect size measures for both multivariate and univariate results.
Post-Hoc Analysis And Reporting
Following significant MANOVA results:
- Conduct appropriate post-hoc tests to identify specific group differences.
- Create visual representations of significant findings through plots or charts.
- Document analysis procedures, assumptions, and results following standard reporting guidelines.
Troubleshooting Common Issues with MANOVA
Several challenges might arise during MANOVA implementation:
Convergence Problems: Often resolved by checking for multicollinearity or increasing iteration limits.
Assumption Violations: May require data transformations or alternative analytical approaches.
Software Limitations: Might necessitate workarounds or alternative software solutions.
This structured approach to performing MANOVA ensures methodological rigor and facilitates clear communication of research findings.
Regular verification of each step maintains analytical quality and supports valid statistical conclusions.
Learn the essential software for creating meaningful statistical charts and graphs with Minitab Essentials
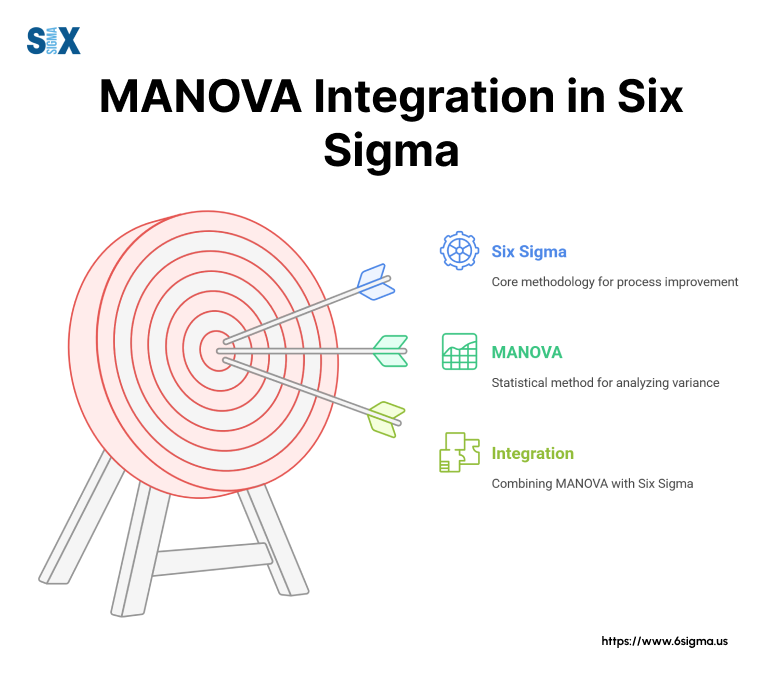
MANOVA In Six Sigma Applications
Multivariate Analysis of Variance (MANOVA) plays a crucial role in Six Sigma methodology, particularly during the analyze and improve phases of DMAIC (Define, Measure, Analyze, Improve, Control).
Integration With Six Sigma Methodology
Within Six Sigma projects, MANOVA serves as a powerful tool for analyzing process variations and their impacts on multiple quality metrics.
Manufacturing processes often require monitoring several output variables simultaneously, such as product dimensions, strength, and weight.
MANOVA enables quality engineers to determine whether process changes affect these multiple characteristics collectively.
Process Optimization Applications of Multivariate Analysis of Variance (MANOVA)
Quality engineers employ MANOVA in various stages of process improvement. During the analyze phase, this method helps identify significant factors affecting multiple quality characteristics.
For instance, in semiconductor manufacturing, MANOVA examines how temperature and pressure changes simultaneously impact chip performance metrics, including speed, power consumption, and heat generation.
Quality Control Implementation
The implementation of MANOVA in quality control processes follows a structured approach. Engineers first identify critical quality characteristics, then design experiments incorporating multiple factors.
The statistical analysis reveals how process adjustments affect various quality metrics simultaneously, enabling more efficient optimization strategies.
Case Study: Manufacturing Process Improvement
A automotive parts manufacturer utilized MANOVA to optimize their injection molding process. The analysis examined three quality characteristics: part density, tensile strength, and surface finish.
Decision Making Framework of Multivariate Analysis of Variance (MANOVA)
MANOVA provides Six Sigma practitioners with a robust decision-making framework.
The method helps determine whether process changes create statistically significant improvements across multiple quality metrics.
This approach prevents sub-optimization, where improving one characteristic might inadvertently deteriorate others.
Integration With Other Six Sigma Tools
MANOVA complements other Six Sigma statistical tools. Process capability analysis, design of experiments, and statistical process control work alongside MANOVA to provide a complete picture of process performance.
This integration enables more effective problem-solving and process optimization strategies.
Future Applications And Trends of MANOVA
Modern manufacturing environments increasingly incorporate automated data collection and real-time analysis.
MANOVA adaptation to these environments includes integration with machine learning algorithms for predictive quality control and automated process adjustments.
This evolution enhances the method’s utility in Industry 4.0 applications.
The application of MANOVA within Six Sigma continues to evolve, particularly as manufacturing processes become more complex and interconnected.
Master Advanced Statistical Analysis in Six Sigma with Six Sigma Champion – Leadership Program
Interpreting And Reporting MANOVA Results
The interpretation of Multivariate Analysis of Variance (MANOVA) results requires systematic evaluation of multiple statistical indicators and careful consideration of practical significance.
Proper interpretation ensures research findings contribute meaningful insights to the field of study.
Understanding Statistical Output
MANOVA output presents several key statistics that require careful examination.
The multivariate test statistics, including Wilks’ Lambda, Pillai’s Trace, Hotelling’s Trace, and Roy’s Largest Root, provide initial indicators of significant effects.
Each statistic offers slightly different information about the relationships between dependent variables and group differences.
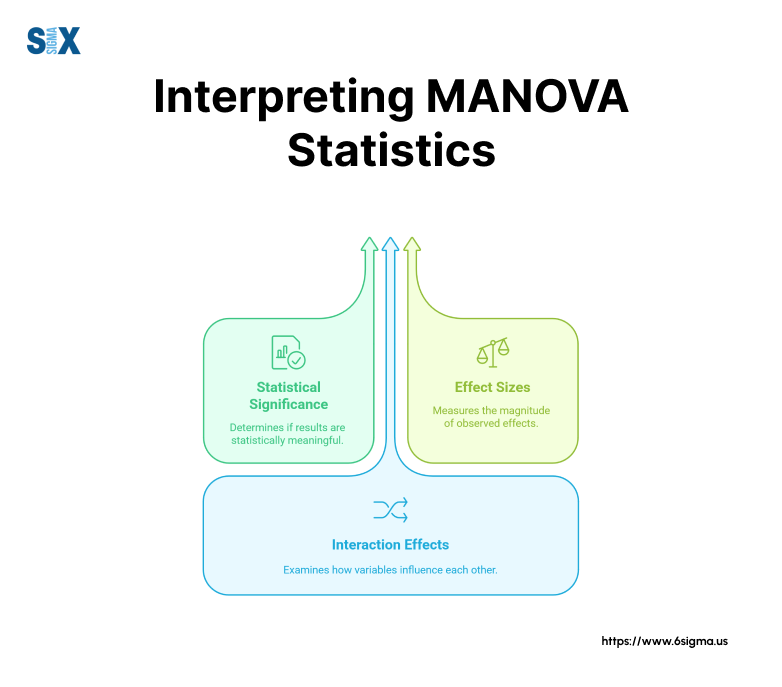
Essential Metrics of MANOVA For Evaluation
The primary metrics demanding attention in MANOVA results include:
Multivariate F-values indicate the overall significance of group differences across dependent variables. P-values associated with these F-statistics determine statistical significance.
Effect sizes, such as partial eta squared, reveal the magnitude of observed effects. Power analysis results demonstrate the ability to detect genuine effects.
Sequential Analysis Process of Multivariate Analysis of Variance
Interpreting MANOVA follows a structured sequence. First, examine multivariate tests for overall significance.
When significant results emerge, analyze univariate F-tests for individual dependent variables. Finally, conduct post-hoc tests to identify specific group differences.
Common Interpretation Challenges of Multivariate Analysis of Variance (MANOVA)
Several interpretation pitfalls require attention. Researchers often mistakenly focus solely on statistical significance while overlooking practical importance.
Another common error involves inappropriate generalization of results beyond study parameters. Additionally, failing to consider the correlations between dependent variables can lead to incomplete interpretations.
Reporting Guidelines And Standards of Multivariate Analysis of Variance (MANOVA)
Professional reporting of MANOVA results demands specific elements:
- Statistical Values: Report test statistics, degrees of freedom, and exact p-values.
- Effect Sizes: Include appropriate effect size measures with confidence intervals.
- Assumptions: Document assumption tests and any violations.
- Post-hoc Analyses: Detail follow-up tests and their results.
Visual Representation Of Results
Effective presentation of MANOVA results often requires visual aids. Tables should display descriptive statistics, including means and standard deviations for each group.
Graphs might show group differences across multiple dependent variables. Path diagrams can illustrate relationships between variables.
Practical Significance Assessment of Multivariate Analysis of Variance (MANOVA)
Beyond statistical significance, researchers must evaluate practical significance. This assessment considers:
- The magnitude of observed differences
- Real-world implications of findings
- Cost-benefit considerations
- Implementation feasibility
Documentation Requirements
Complete documentation includes:
- Detailed description of analysis procedures
- Justification for statistical choices
- Discussion of assumption violations and remedial measures
- Limitations and generalizability boundaries
The interpretation and reporting of MANOVA results require balanced consideration of statistical significance, practical importance, and study context.
This approach ensures research findings contribute meaningful insights while maintaining scientific rigor.
Common Pitfalls And Limitations
Multivariate Analysis of Variance (MANOVA) presents several challenges and limitations that researchers must navigate carefully.
Statistical Design Errors
Researchers frequently encounter design-related issues when implementing MANOVA. Insufficient sample sizes often lead to unreliable results, particularly as the number of dependent variables increases.
The relationship between variables requires careful consideration, as both high correlations (multicollinearity) and low correlations between dependent variables can compromise the analysis.
Assumption Violation Consequences
MANOVA’s statistical assumptions frequently pose challenges in real-world applications. Multivariate normality rarely occurs perfectly in practice, while heterogeneity of variance-covariance matrices can distort results.
Missing data handling decisions might introduce bias, especially when data are not missing completely at random.
Implementation Challenges of Multivariate Analysis of Variance (MANOVA)
The technical execution of MANOVA presents several obstacles. Software limitations might restrict analysis options or produce misleading output.
Researchers sometimes misinterpret statistical significance, focusing solely on p-values while neglecting effect sizes and practical significance.
The complexity of multiple dependent variables often leads to difficulties in result interpretation and communication.
Limitations Of The Method
MANOVA exhibits inherent limitations that affect its applicability. The method becomes less powerful as the number of dependent variables increases.
Outliers exert strong influence on results, potentially leading to misleading conclusions. The requirement for interval or ratio-level dependent variables restricts its use with categorical outcomes.
Alternative Analytical Approaches of Multivariate Analysis of Variance (MANOVA)
When MANOVA proves unsuitable, several alternatives merit consideration:
- Separate univariate analyses might suffice when dependent variables show minimal correlation.
- Non-parametric multivariate methods offer solutions when assumptions cannot be met.
- Structural equation modeling provides options for complex variable relationships.
- Mixed-effects models handle repeated measures and nested data structures effectively.
Remedial Strategies
Several strategies help address common MANOVA limitations:
- Data transformation techniques can improve normality and homogeneity.
- Robust statistical methods provide alternatives when assumptions fail.
- Increased sample sizes might overcome some statistical power issues.
- Multiple imputation methods handle missing data appropriately.
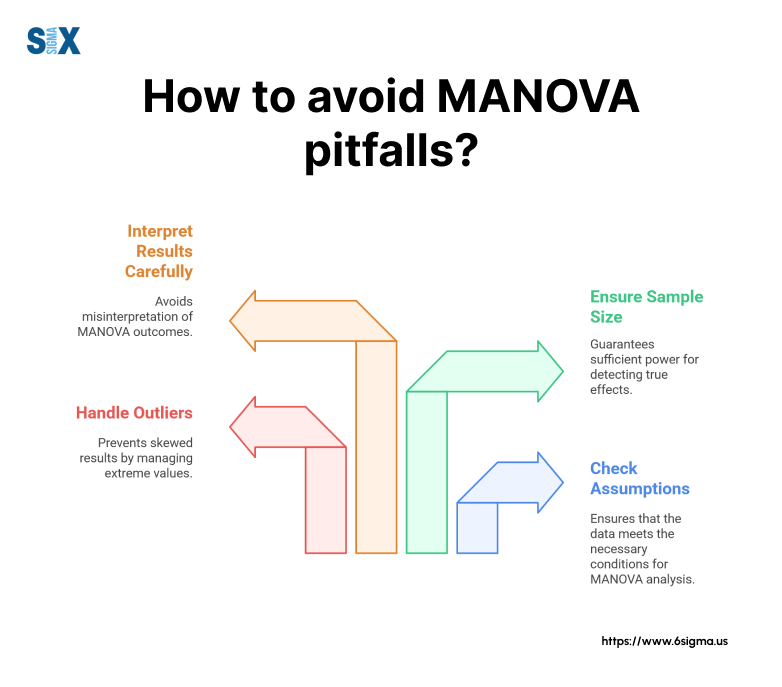
Prevention And Best Practices of Multivariate Analysis of Variance (MANOVA)
Careful planning helps avoid many common pitfalls:
- Thorough preliminary data screening identifies potential problems early.
- Power analysis ensures adequate sample sizes for reliable results.
- Clear theoretical frameworks guide variable selection and interpretation.
- Regular assumption checking maintains statistical validity.
Future Considerations
Emerging analytical approaches may address current MANOVA limitations. Machine learning techniques offer new ways to handle multiple dependent variables.
Advanced computational methods might provide more robust solutions for assumption violations. Integration with other statistical methods may expand MANOVA’s applicability.
Understanding these limitations and pitfalls enables researchers to make informed decisions about MANOVA’s appropriateness for their specific research questions.
This knowledge also helps in implementing appropriate preventive measures and selecting suitable alternatives when necessary.
Conclusion
The application of Multivariate Analysis of Variance continues to evolve across diverse fields.
This statistical method provides researchers with powerful tools for analyzing complex relationships between multiple dependent variables.
Key Implementation Guidelines
Successful MANOVA implementation requires careful attention to:
- Statistical assumptions verification
- Appropriate sample size determination
- Proper variable selection and measurement
- Thorough results interpretation and reporting
Future Directions of Multivariate Analysis of Variance
The integration of MANOVA with emerging technologies and methodologies promises enhanced analytical capabilities.
Machine learning algorithms may extend traditional MANOVA applications, while automated data collection systems could facilitate real-time analysis in various industries.
Additional Resources
Researchers seeking to deepen their understanding of MANOVA should consult:
- Statistical software documentation
- Peer-reviewed methodology papers
- Professional development workshops
- Online statistical communities
The successful application of MANOVA depends on proper understanding of both theoretical foundations and practical implementation strategies.
These examples demonstrate how careful application of MANOVA principles leads to meaningful research conclusions across diverse fields.
SixSigma.us offers both Live Virtual classes as well as Online Self-Paced training. Most option includes access to the same great Master Black Belt instructors that teach our World Class in-person sessions. Sign-up today!
Virtual Classroom Training Programs Self-Paced Online Training Programs


