Understanding Matrix Diagram: A Guide for Manufacturing and Operations
A matrix diagram serves as a powerful visual tool for analyzing relationships between different sets of information.
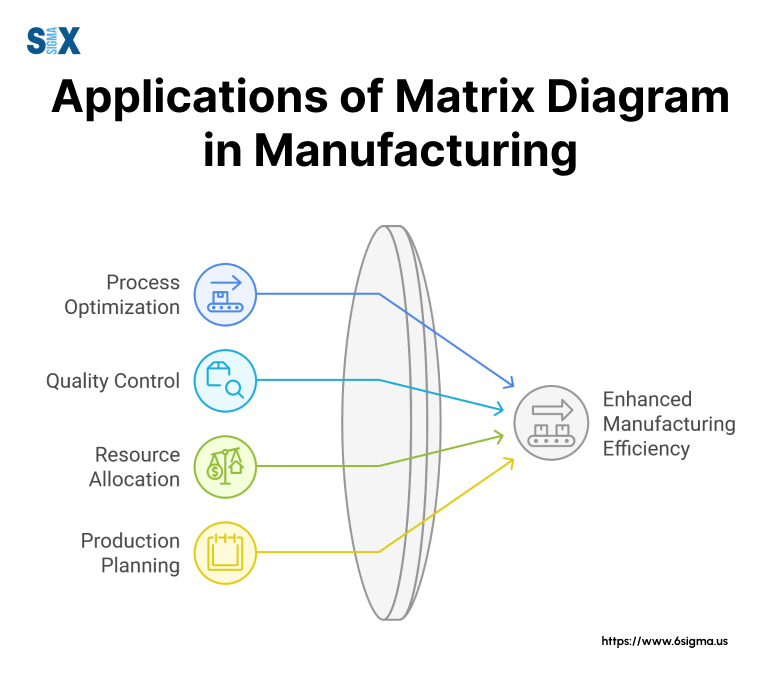
Manufacturing professionals and operations managers use these diagrams to map complex data relationships, identify process bottlenecks, and make informed decisions about resource allocation.
Think of a matrix diagram as a structured grid that reveals connections between various elements in your manufacturing or operational processes.
Key Highlights
- Creating effective matrix diagrams for process analysis
- Matching production requirements with available resources
- Identifying improvement opportunities in manufacturing
- Optimizing workflow patterns and dependencies
What Is A Matrix Diagram?
A matrix diagram functions as a structured analytical tool that displays relationships between multiple sets of data in a grid format.
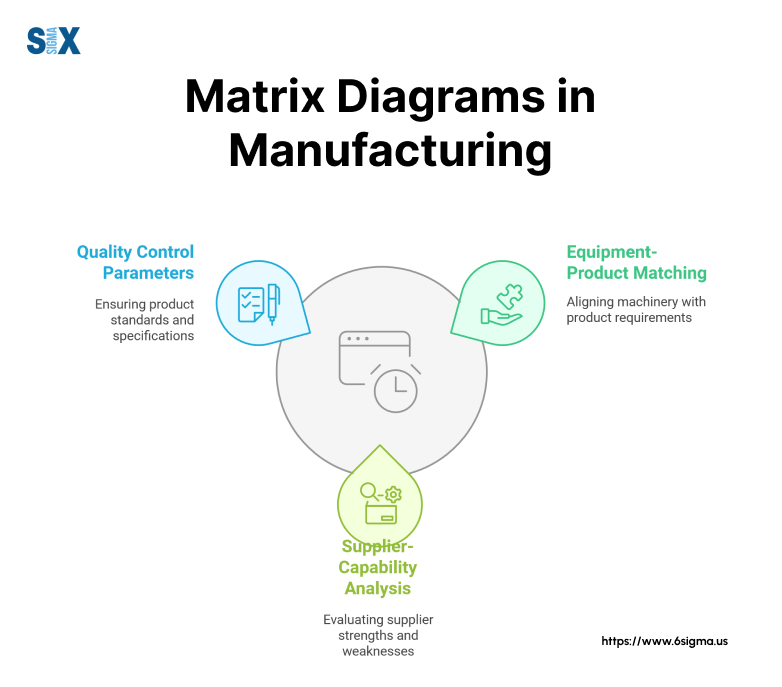
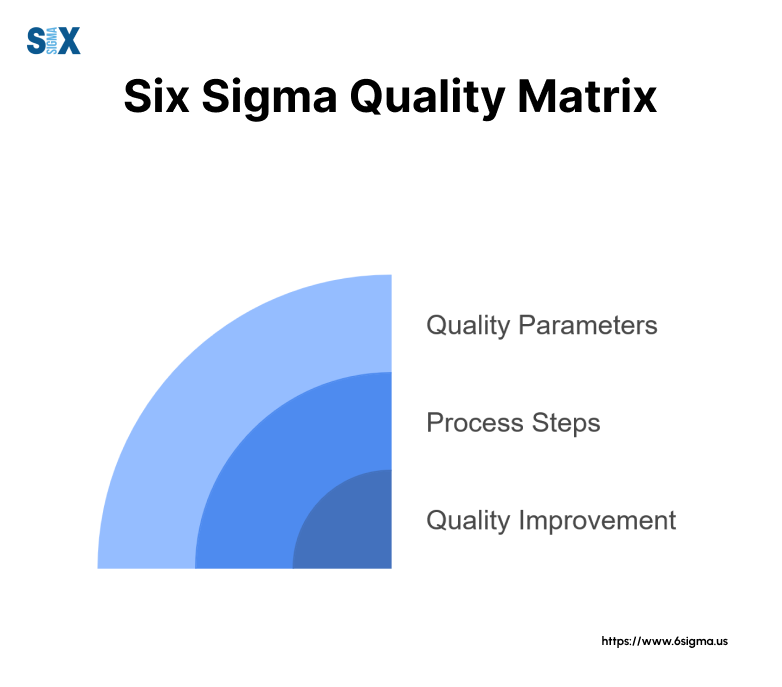
Manufacturing teams use these diagrams to visualize and evaluate connections between different variables, such as production requirements, equipment capabilities, and quality parameters.
Basic Structure And Elements
The basic structure of a matrix diagram consists of rows and columns that intersect to form cells. These cells show relationships between the items listed in the rows and columns.
For example, a manufacturing matrix diagram might list production processes on one axis and quality requirements on the other, with the intersecting cells indicating the strength or type of relationship between them.
Master the fundamentals of Process Variables Mapping to enhance your operational efficiency.
Key Functions of Matrix Diagram In Manufacturing
Manufacturing professionals rely on matrix charts to solve complex operational challenges.
When a production line needs optimization, the matrix diagram helps identify bottlenecks by mapping process dependencies.
Operations managers use these tools to match equipment capabilities with product specifications, ensuring efficient resource allocation.
Types Of Relationships Shown
Matrix diagrams display various relationship types through symbols or numbers in the intersecting cells.
Strong relationships might be marked with a solid circle, moderate ones with a half-filled circle, and weak relationships with an empty circle.
For instance, in quality control, these symbols could show how strongly each manufacturing step influences specific product characteristics.
Applications of Matrix Diagram In Industrial Settings
Industrial engineers often apply matrix diagrams to:
- Track quality control parameters across production stages
- Map equipment maintenance requirements to production schedules
- Analyze supplier capabilities against product specifications
- Evaluate worker skill sets against job requirements
Benefits For Process Improvement
Process improvement specialists value matrix diagrams for their ability to reveal hidden patterns and relationships.
These visual tools help teams identify improvement opportunities by showing where processes intersect and how changes in one area might affect others.
Business leaders use this information to make data-driven decisions about resource allocation and process optimization.
Matrix diagrams stand out from other analytical tools because they provide clear visual representation of complex relationships that might otherwise be difficult to understand or communicate.
They transform abstract connections into tangible patterns that manufacturing teams can act upon to improve their operations.
Types Of Matrix Diagrams For Manufacturing Applications
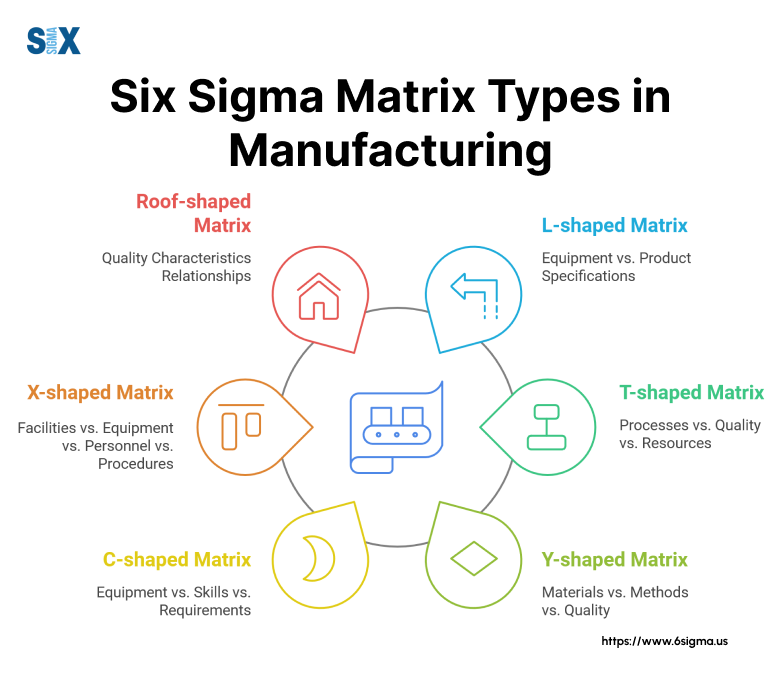
Manufacturing and operations teams select specific matrix diagram types based on the number of variables they need to analyze and the relationships they want to explore.
Each type serves distinct purposes in process improvement and operational analysis.
L-Shaped Matrix Diagrams
The L-shaped matrix diagram excels in comparing two groups of elements.
Manufacturing teams frequently use this format to match production equipment with product specifications or to evaluate supplier capabilities against quality requirements.
For example, a quality control team might create an L-shaped matrix to show how different testing methods affect various product characteristics.
T-Shaped Matrix Diagrams
T-shaped diagrams handle three groups of elements, where one central group connects to two others without those two relating directly.
Operations managers often implement this structure when analyzing how production processes affect both product quality and resource utilization, while quality and resources don’t directly influence each other.
Y-Shaped Matrix Diagrams
The Y-shaped format shows relationships between three groups in a circular pattern.
Process improvement specialists favor this type when examining how materials, manufacturing methods, and quality specifications interact.
Each element group connects directly to the other two, creating a complete relationship circle.
C-Shaped Matrix Diagrams
C-shaped diagrams display three-dimensional relationships between groups.
Industrial engineers use these to analyze complex manufacturing scenarios where multiple factors interact simultaneously, such as evaluating equipment, operator skills, and product requirements together.
X-Shaped Matrix Diagrams
X-shaped matrices handle four groups of elements, connecting each group to two others in a circular pattern.
Business leaders employ this format when analyzing broader operational aspects, like how facilities, equipment, personnel, and procedures interact across multiple production lines.
Roof-Shaped Matrix Diagram(s)
The roof-shaped variant typically accompanies other matrix types, showing relationships within a single group of elements.
Manufacturing teams use this to identify how different quality characteristics influence each other or how various process parameters interact.
Selecting The Right Matrix Type
The choice of matrix diagram depends on the manufacturing challenge at hand.
Simple two-variable comparisons work well with L-shaped matrices, while more complex operational analyses might require X-shaped or C-shaped formats.
The key lies in matching the matrix structure to the specific analytical needs of the manufacturing process.
Transform your process analysis skills with our Cause and Effect Matrix certification
The Structure Of A Matrix Diagram In Manufacturing
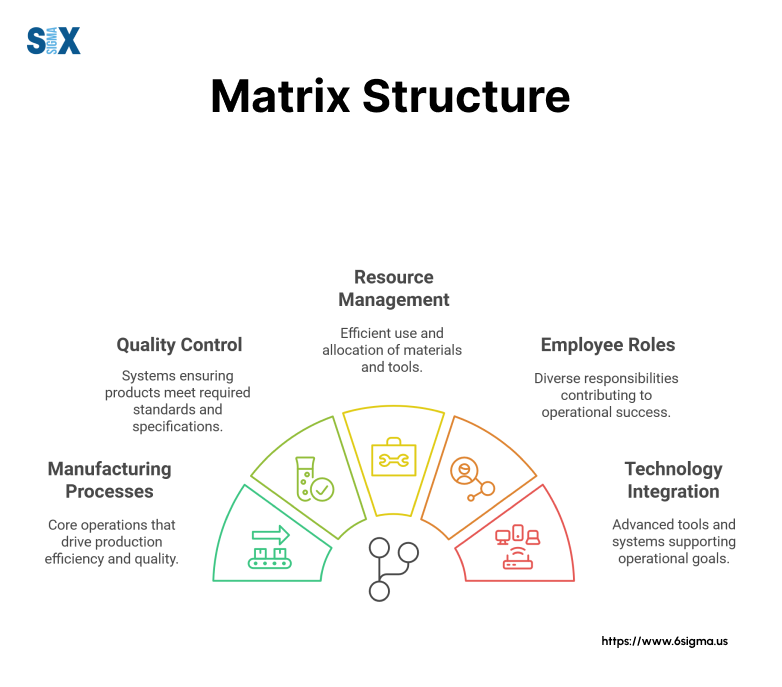
Manufacturing professionals need to understand the key components of a matrix diagram to effectively analyze operational relationships.
Each element serves a specific purpose in presenting clear, actionable data for process improvement.
Basic Components And Layout
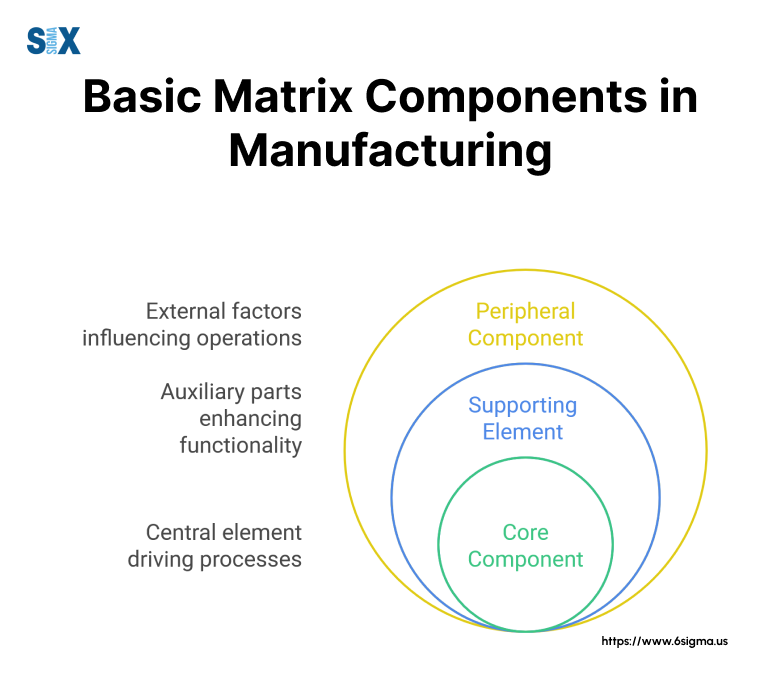
The foundation of a matrix diagram consists of rows and columns that create a grid structure.
In manufacturing settings, the left column typically lists process steps or equipment, while the top row might contain quality parameters or product specifications.
This grid formation enables clear visualization of relationships between different operational elements.
Relationship Indicators of a Matrix Diagram
The intersecting cells in a matrix structure diagram contain symbols or values that show relationship strength or type. Common indicators include:
- Strong relationship: ● (filled circle)
- Medium relationship: ◐ (half-filled circle)
- Weak relationship: ○ (empty circle)
- No relationship: Blank cell
These indicators help operations managers quickly identify critical connections between processes and outcomes.
Header Elements
The header section contains titles and descriptions that clearly identify the variables being analyzed.
For example, a manufacturing matrix organizational structure diagram might list production stations across the top and quality parameters down the side, with a clear title describing the analysis purpose.
Data Organization of a Matrix Diagram
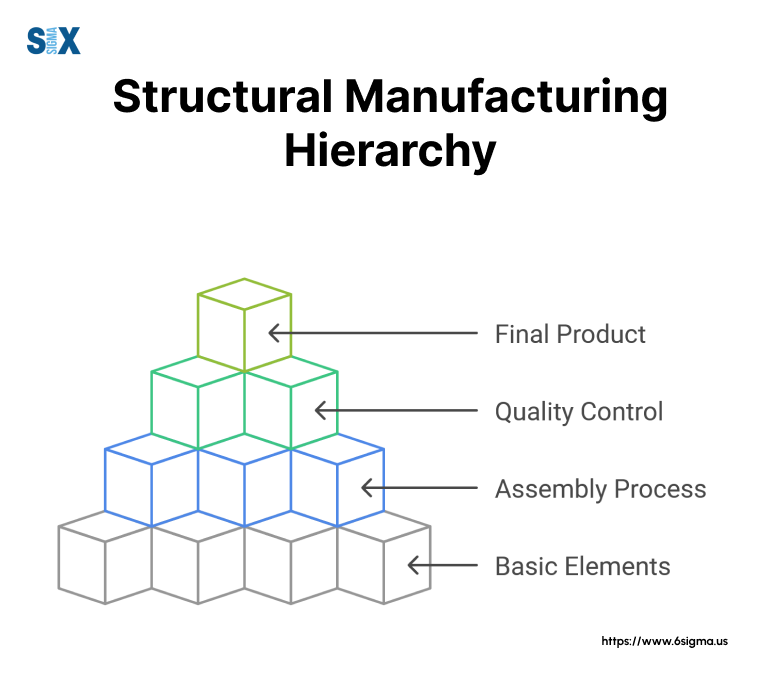
Matrix diagrams organize data hierarchically, moving from general to specific information.
Industrial engineers often structure their matrices with primary processes on one axis and sub-processes or detailed requirements on the other, creating clear relationships between different operational levels.
Supporting Information
Key supporting elements include:
- Legend explaining relationship symbols
- Summary sections for totals or averages
- Notes section for special conditions
- Reference information for data sources
Quantitative Elements of a Matrix Diagram
Process improvement specialists often incorporate numerical values in matrix diagrams. These might represent:
- Production cycle times
- Quality metrics
- Cost factors
- Resource requirements
Visual Enhancement Features of a Matrix Diagram
Color coding and shading help highlight patterns and emphasize important relationships.
Business leaders particularly value these visual elements for quick analysis and decision-making. For instance, red might indicate critical relationships, while yellow shows moderate importance.
Integration Points
Modern matrix diagrams often include integration points with other manufacturing tools and systems.
These connections help link the matrix analysis to broader operational management systems and data sources.
Creating A Matrix Diagram For Manufacturing Operations
Define The Analysis Objective
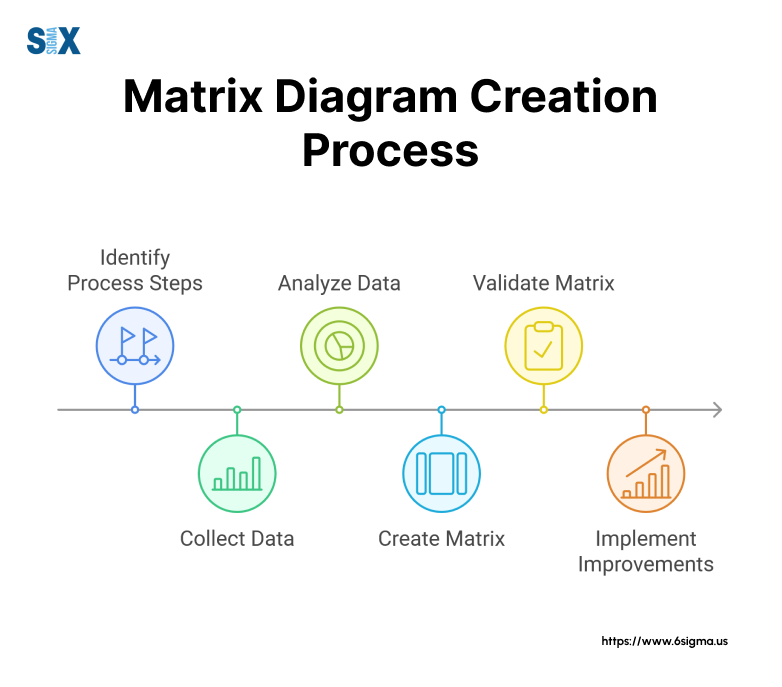
The first step in creating a matrix diagram involves identifying the specific manufacturing challenge to address.
Operations managers must clearly state what they want to analyze, such as the relationship between production processes and quality outcomes, or equipment capabilities and product specifications.
Identify Key Variables for a Matrix Diagram
Manufacturing teams need to determine which variables will populate the rows and columns.
For a production analysis, these might include machine types, product features, quality parameters, or process steps.
The selected variables should directly relate to the stated objective and provide meaningful insights for process improvement.
Select The Appropriate Format
Based on the number of variable sets, choose the most suitable matrix diagram template.
Simple two-variable analyses work well with L-shaped matrices, while more complex operational relationships might require T-shaped or X-shaped formats.
Gather Required Data with a Matrix Diagram
Industrial engineers must collect relevant data from various sources including:
- Production records
- Quality control reports
- Equipment specifications
- Process documentation
- Historical performance data
Design The Basic Structure
When learning how to make a matrix chart, start by creating the basic framework.
List one set of variables along the vertical axis and the other across the horizontal axis. Ensure clear labeling and sufficient space for relationship indicators.
Define Relationship Indicators
Establish a clear system for showing relationships between variables. Process improvement specialists typically use:
- Numerical scales (1-3 or 1-5)
- Symbolic representations (●, ◐, ○)
- Color coding schemes
- Weight factors
Populate The Matrix with a Matrix Diagram
Business leaders and team members should work together to analyze each intersection point and assign appropriate relationship indicators.
This step requires careful consideration of actual operational data and expert knowledge of manufacturing processes.
Review And Validate
Manufacturing professionals must verify the accuracy of the relationships shown in the matrix diagram. This validation process might involve:
- Cross-checking with historical data
- Consulting process experts
- Testing assumptions
- Reviewing with stakeholders
Document Supporting Information for a Matrix Diagram
Include relevant notes, legends, and reference information that help others understand and use the matrix effectively.
This documentation ensures consistent interpretation across different manufacturing teams and shifts.
Plan For Updates
Create a system for regularly updating the matrix as processes change or new data becomes available. This ensures the tool remains valuable for ongoing process improvement efforts.
Matrix Diagrams In Six Sigma Quality Management
Matrix diagrams play a crucial role in Six Sigma methodology, serving as powerful tools for quality improvement and process optimization.
These visual aids help manufacturing teams identify, analyze, and eliminate defects in production processes.
Role In DMAIC Process
Within the Define-Measure-Analyze-Improve-Control (DMAIC) framework, matrix chart systems support multiple phases of improvement projects.
Quality teams use these tools during the Analyze phase to identify root causes of defects and during the Improve phase to evaluate potential solutions.
Quality Function Deployment Integration
Six Sigma practitioners frequently incorporate matrix diagrams into Quality Function Deployment (QFD) analysis.
The House of Quality, a specialized matrix diagram in Six Sigma, translates customer requirements into specific technical specifications that manufacturing teams can implement.
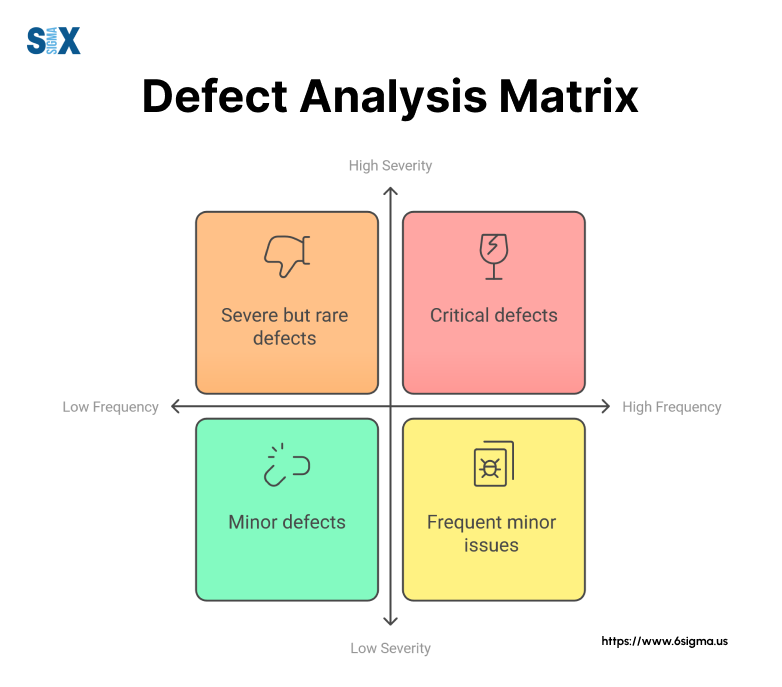
Defect Analysis Applications of a Matrix Diagram
When analyzing defects, quality engineers create matrix diagrams to map relationships between:
- Process parameters and defect types
- Machine settings and quality outcomes
- Material properties and product characteristics
- Operator actions and quality metrics
Process Capability Mapping
Manufacturing teams use matrix diagrams in Six Sigma to evaluate process capabilities against customer requirements.
This analysis helps identify gaps between current performance and desired quality levels, guiding improvement efforts effectively.
Root Cause Investigation
Six Sigma projects employ cause-and-effect matrix diagrams to prioritize potential root causes of quality issues.
These tools help process improvement specialists assign numerical weights to different factors, focusing resources on the most critical areas for improvement.
Control Plan Development with a Matrix Diagram
Matrix diagrams support the development of control plans by showing relationships between:
- Critical quality characteristics
- Process control points
- Measurement methods
- Response plans
Statistical Analysis Integration
Modern matrix chart systems in Six Sigma often integrate with statistical analysis tools, enabling teams to:
- Track process performance metrics
- Monitor quality trends
- Analyze correlation patterns
- Document improvement results
Team Communication Tool
Quality improvement teams use matrix diagrams to communicate complex relationships to various stakeholders.
These visual tools help align different departments around common quality objectives and improvement strategies.
Continuous Improvement Support with a Matrix Diagram
As part of ongoing Six Sigma initiatives, matrix diagrams help track the effectiveness of implemented solutions and identify new improvement opportunities.
This systematic approach ensures sustained quality enhancement in manufacturing operations.
Strengthen your Six Sigma implementation with our Cause and Effect Matrix course to prioritize KPIVs and KPOVs for maximum impact
Common Mistakes When Creating Matrix Diagrams In Manufacturing
Manufacturing teams often encounter several pitfalls when developing and implementing matrix diagrams.
Understanding these common errors helps ensure more effective analysis and better decision-making outcomes.
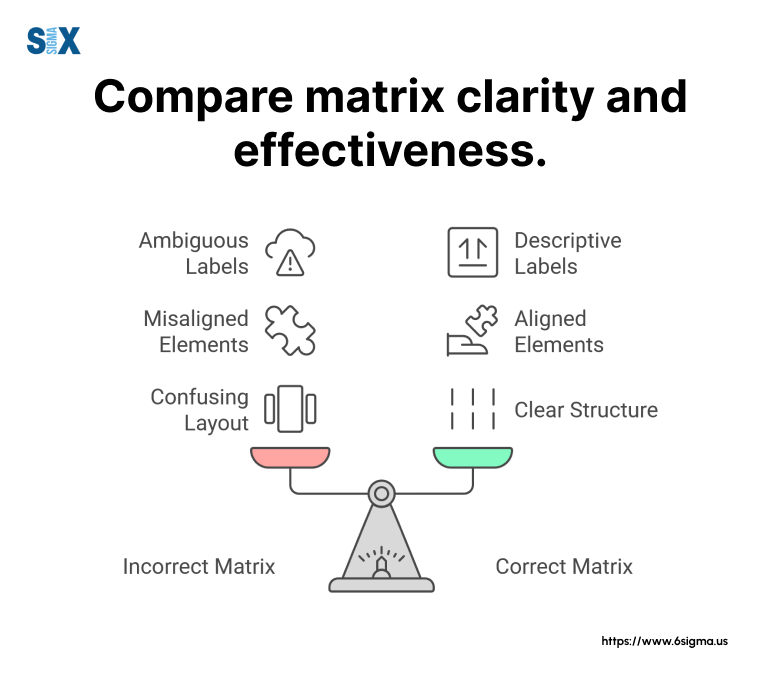
Overcrowding The Matrix
One frequent mistake involves cramming too many variables into a single matrix diagram. This overloading makes the tool difficult to read and analyze.
Instead, break complex analyses into multiple focused matrices that address specific operational aspects. For example, separate quality parameters from production capabilities into two distinct matrices.
Incorrect Format Selection of a Matrix Diagram
The matrix diagram architecture must match the analysis needs.
Using an L-shaped matrix when relationships between three variable sets need examination limits the analysis effectiveness.
Operations managers should carefully evaluate their data requirements before selecting the matrix format.
Inconsistent Relationship Indicators
Manufacturing teams sometimes use varying symbols or scoring systems within the same matrix. This inconsistency leads to confusion and misinterpretation.
Establish clear, standardized indicators before starting the analysis and maintain them throughout the document.
Missing Context Information
Process improvement specialists often overlook the importance of including supporting information.
Each matrix diagram needs clear titles, legends, and notes explaining the context and methodology used in the analysis.
Inadequate Data Validation within the Matrix Diagram
Industrial engineers might rush to populate the matrix without properly validating the relationships. This haste results in unreliable conclusions.
Teams should verify each relationship through data analysis and expert consultation before finalizing the matrix.
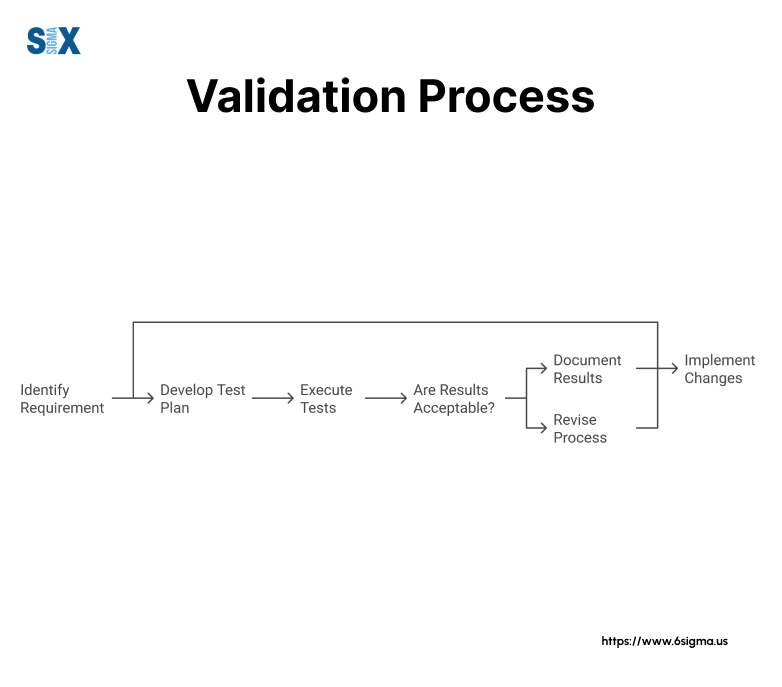
Poor Visual Organization
Disorganized layout and formatting make matrix diagrams harder to interpret. Key elements for clear organization include:
- Logical variable grouping
- Consistent spacing
- Clear headings
- Appropriate font sizes
- Strategic color usage
Neglecting Updates
Manufacturing processes evolve, but teams often fail to update their matrix diagrams accordingly.
Establish regular review cycles to ensure the tool remains relevant and accurate for current operations.
Insufficient Stakeholder Input with the Matrix Diagram
Creating matrix diagrams without involving key stakeholders leads to missed relationships and incorrect assessments.
Include relevant team members and subject matter experts in the development process to ensure accurate relationship mapping.
Documentation Gaps
Business leaders need clear documentation explaining how the matrix was developed and should be used.
Include methodology notes, data sources, and update procedures to maintain the tool’s effectiveness over time.
Implementation Without Training
Rolling out matrix diagrams without proper team training limits their effectiveness.
Ensure all users understand how to interpret and use the matrix for decision-making in their daily operations.
Moving Forward With Matrix Diagrams In Manufacturing
Matrix diagrams serve as essential tools for manufacturing operations, providing clear insights into process relationships and improvement opportunities.
Their systematic approach to data organization and analysis makes them invaluable for modern manufacturing environments.
Key Implementation Takeaways
Success with matrix diagrams depends on proper planning, consistent execution, and regular updates.
Manufacturing teams achieve the best results when they start with simple analyses and gradually progress to more complex applications.
Using standardized matrix diagram templates helps ensure consistency across different departments and projects.
Next Steps For Implementation
Operations managers should begin by identifying one critical process area that needs relationship analysis.
Start with an L-shaped matrix to analyze basic relationships, then expand to more complex formats as team expertise grows.
Regular team training and feedback sessions help maintain effective use of these tools.
Integration of Matrix Diagram With Existing Systems
Process improvement specialists should focus on integrating matrix diagrams with current quality management and operational systems.
This integration ensures sustained value and regular usage of the tools across manufacturing operations.
Measuring Success
Industrial engineers can track the effectiveness of matrix diagram implementation through:
- Reduced process variation
- Improved quality metrics
- Faster problem resolution
- Better cross-functional communication
- Enhanced decision-making speed
Future Development Opportunities with a Matrix Diagram
Manufacturing teams should explore digital tools and software that support matrix diagram creation and maintenance.
These technologies offer improved data integration, real-time updates, and enhanced visualization capabilities.
Building Organizational Capability
Business leaders must invest in developing their teams’ skills in creating and using matrix diagrams.
This investment pays off through improved process understanding and more effective problem-solving capabilities.
Final Recommendations
Manufacturing organizations should establish clear protocols for matrix diagram usage, including:
- Standard creation procedures
- Regular review cycles
- Update responsibilities
- Training requirements
- Documentation standards
The successful implementation of matrix diagrams leads to improved operational efficiency, better quality outcomes, and more informed decision-making across manufacturing operations.
SixSigma.us offers both Live Virtual classes as well as Online Self-Paced training. Most option includes access to the same great Master Black Belt instructors that teach our World Class in-person sessions. Sign-up today!
Virtual Classroom Training Programs Self-Paced Online Training Programs


