Levene’s Test: Your Guide to Understanding, Performing, and Interpreting Homogeneity of Variance
Variations in data, especially when making business decisions might end up in fatal errors.
Assessing this variability in data is crucial, and that’s where Lavene’s test stands as a robust and proven method to evaluate whether data in different groups have equal variances.
Levene’s test holds as a fundamental block for many advanced analytical methods used in Six Sigma certification programs and process improvement.
This article will equip you to:
- The fundamental principles behind Levene’s test and why it’s crucial for statistical analysis
- When and how to apply this test
- Common pitfalls and how to avoid them
- Practical examples from various industries where Levene’s test has proven invaluable
What is Levene’s Test?
Levene’s test for equality of variances serves as a gatekeeper for many statistical analyses we commonly use in process improvement. This test is employed to validate whether different manufacturing processes exhibited similar levels of variation.
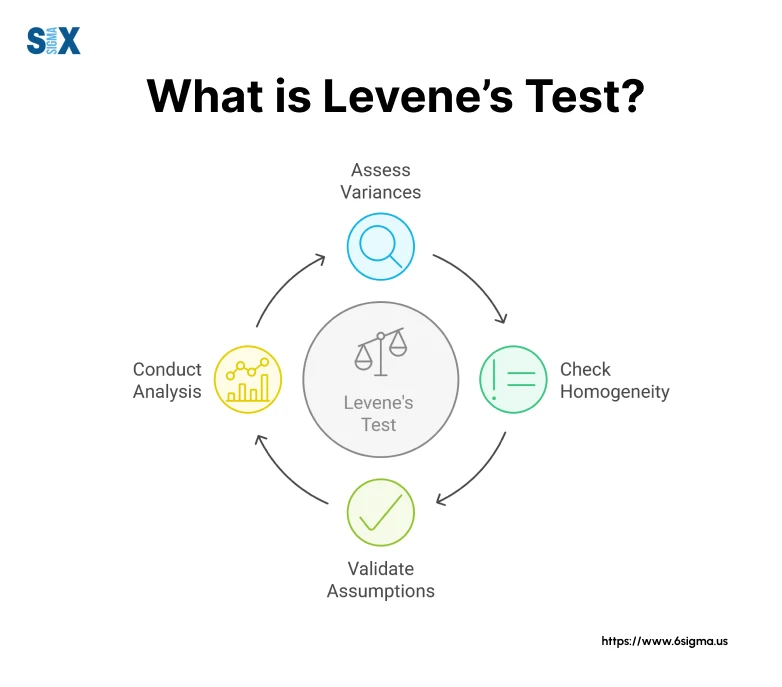
The test essentially tells you whether the spread of your data is consistent across different groups or conditions – a fundamental assumption for many statistical procedures.
When performing Levene’s test of equality of error variances, you’re asking: “Are the variations in our different sample groups similar enough to be considered equal?”
Historical Context
Developed by Howard Levene in 1960, this test emerged as a more robust alternative to earlier methods of testing variance homogeneity.
The test has undergone several refinements over the years, including Brown and Forsythe’s modification in 1974, which made it even more robust against non-normal data – something I’ve found invaluable in applications where perfect normality is rare.
When to Use Levene’s Test
This test is essential to compare means between groups using methods like ANOVA or t-tests. However, it’s not necessary for all statistical analyses. For example, you can skip Levene’s test when using non-parametric methods or when your sample sizes are approximately equal across groups.
Using Levene’s test should be based on specific analytical needs and the nature of the data.
Master Statistical Analysis for Process Improvement?
Our Introduction to Statistics course will help you understand and apply critical tests like Levene’s, ensuring more accurate business decisions. Start your journey to data-driven excellence!
The Mechanics of Levene’s Test: Calculating Levene Test Statistic
Understanding the mechanical underpinnings of Levene’s test is crucial for its effective application. Let’s break down the essential components in both manufacturing and business process improvement.
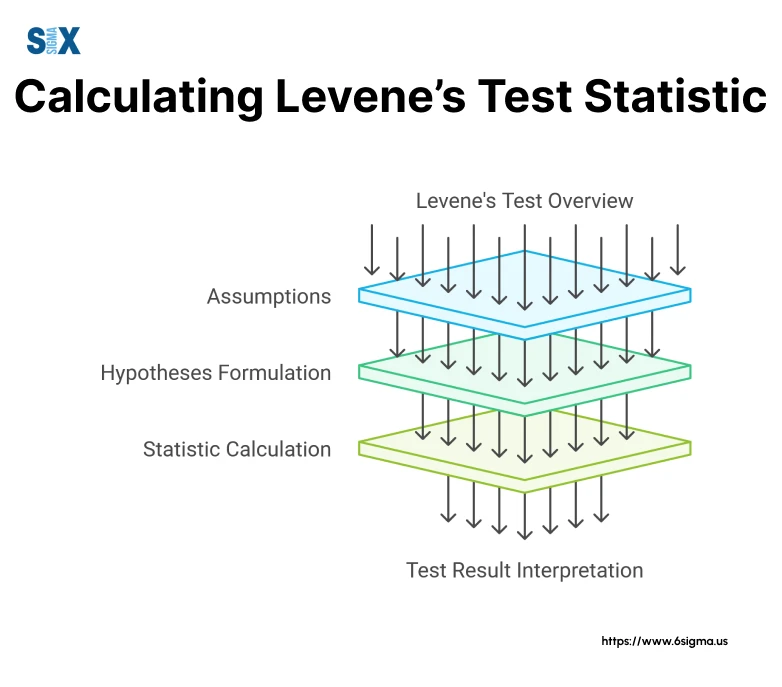
Assumptions
Levene’s test is relatively robust, it still relies on certain assumptions. The two primary assumptions are independent observations and continuous data measurement.
Unlike many other statistical tests, Levene’s test doesn’t strictly require normally distributed data, something particularly valuable when working with real-world manufacturing processes.
When these assumptions are violated, the test’s reliability can be compromised. In such cases, I typically recommend alternative approaches or data transformation methods to ensure valid conclusions.
Null and Alternative Hypotheses
The foundation of Levene’s test lies in its hypothesis structure. The null hypothesis (H₀) states that the population variances are equal across all groups.
In simpler terms, we’re assuming that the spread of our data is the same in all groups we’re comparing. The alternative hypothesis (H₁) suggests that at least two groups have different variances.
Want to Confidently Perform and Interpret Statistical Tests like Levene’s?
Our Hypothesis Testing course will give you the skills to analyze business processes and make data-backed decisions. Enhance your analytical capabilities!
Test Statistic Calculation
The Levene test statistic is calculated through a series of steps.
First, we calculate the absolute differences between each observation and its group mean (or median, depending on the variant used). The Levene test statistics are then derived through an ANOVA-like procedure on these differences.
The formula for the Levene test statistic is:
W = [(N-k)Σᵢ(nᵢ(Zᵢ.-Z..)²)]/[(k-1)Σᵢ Σⱼ(Zᵢⱼ-Zᵢ.)²]
Where:
- N is the total sample size
- k is the number of groups
- Zᵢⱼ represents the absolute differences
- Zᵢ. and Z.. are group and overall means of these differences
Interpretation of Results
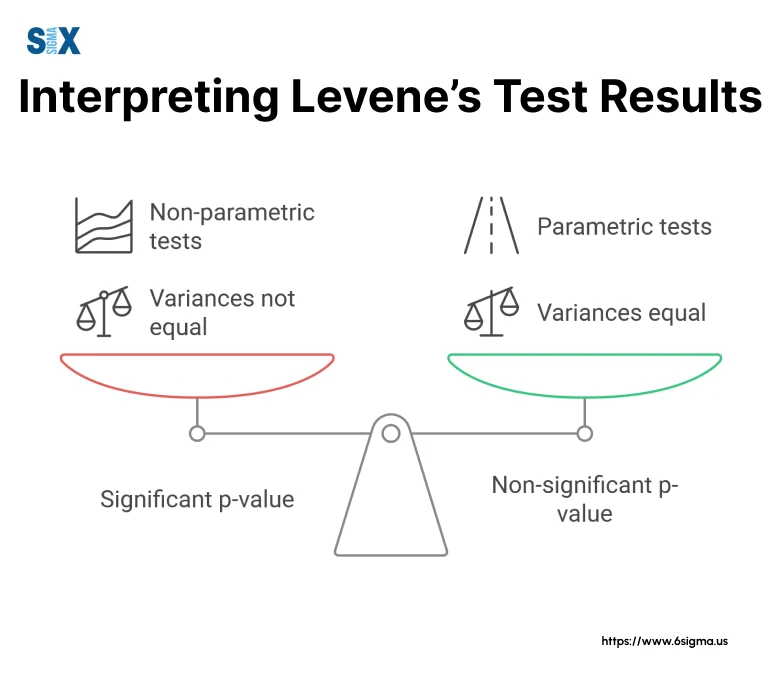
The key to Levene’s test interpretation lies in understanding the p-value in context.
When interpreting Levene’s test, we typically use a significance level of 0.05. If the p-value is less than 0.05, we reject the null hypothesis, indicating unequal variances. I’ve seen cases where a significant result (p < 0.05) led to important process insights and necessary modifications in analytical approaches.
Always pay caution when interpreting Levene’s test results mechanically. I’ve encountered situations where strictly adhering to the 0.05 threshold without considering practical significance could lead to suboptimal decisions. The key is to balance statistical significance with practical importance.
Performing Levene’s Test
The practical application of Levene’s test can seem daunting at first. Here’s an approach to performing this essential statistical analysis.
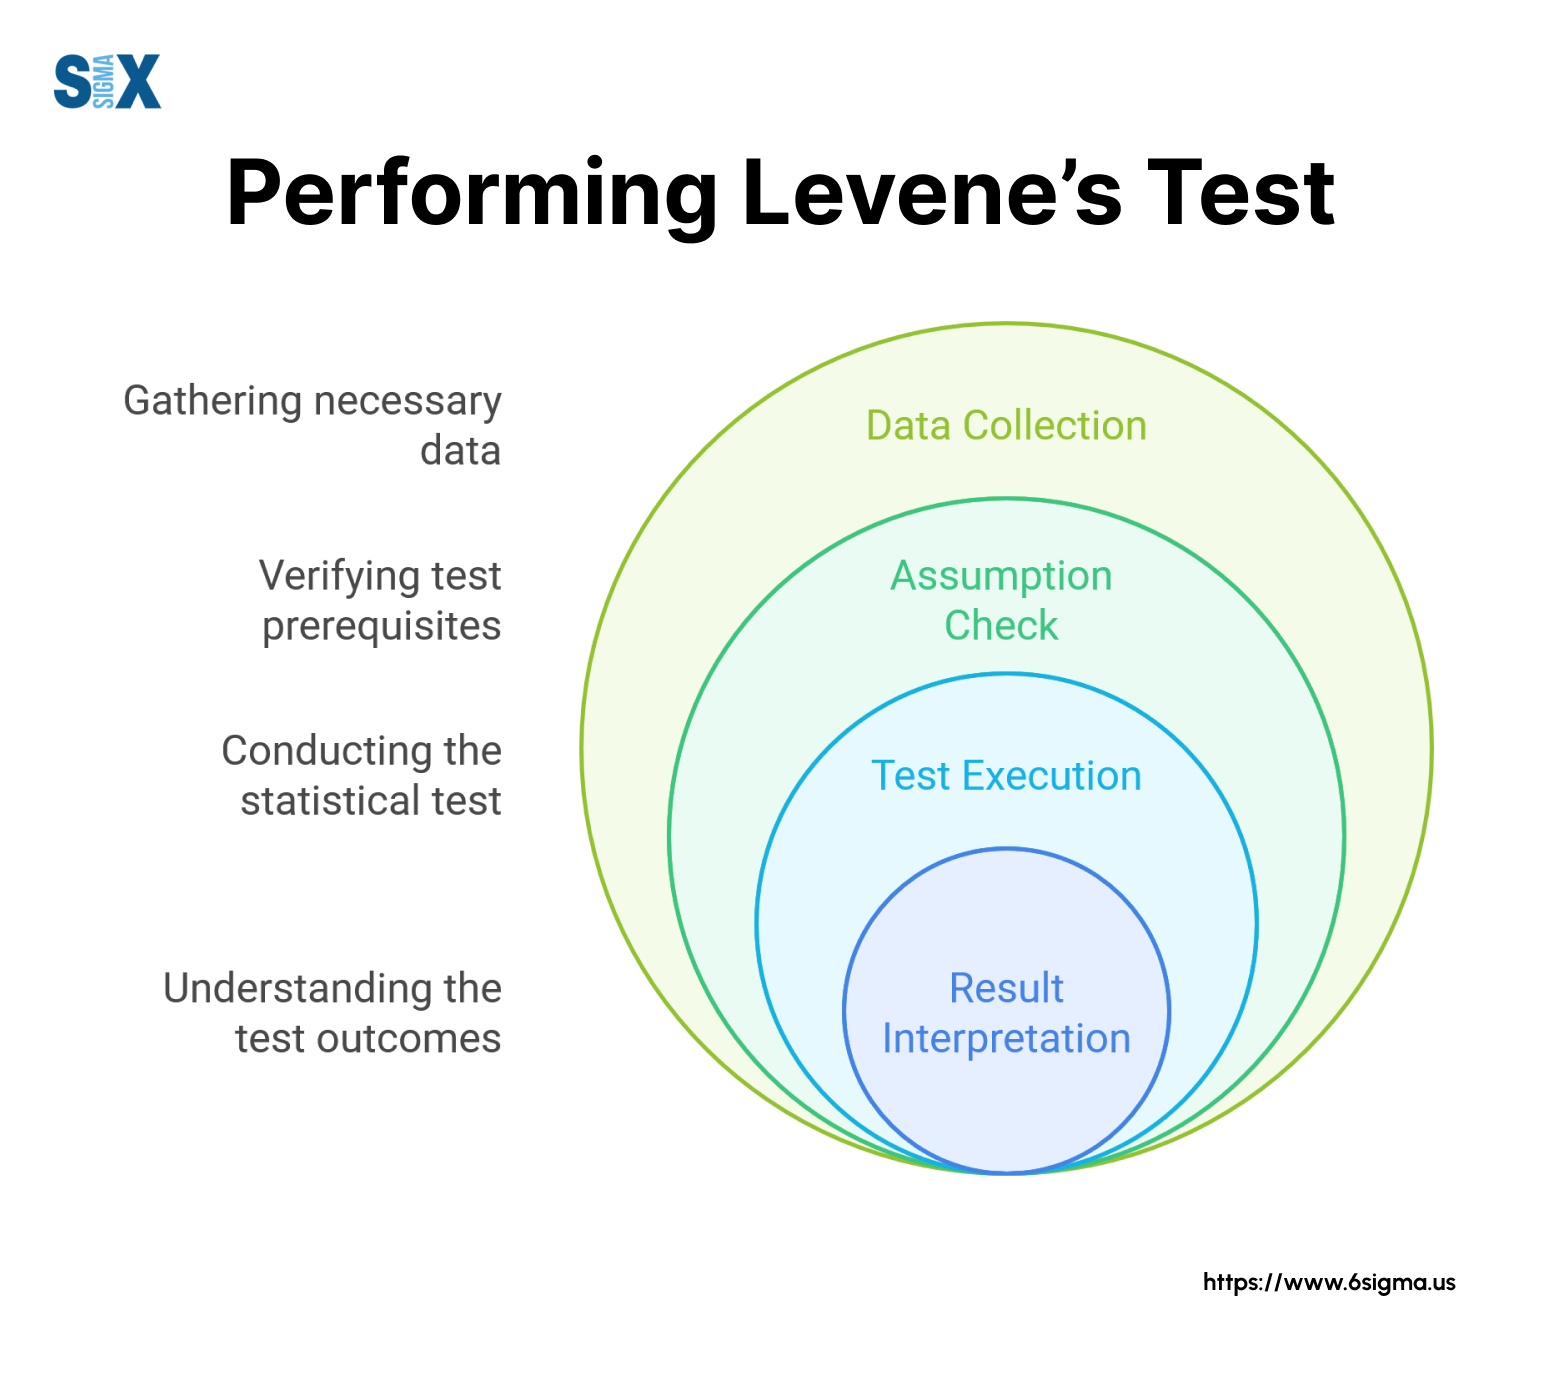
Manual Calculation Example
While modern software has simplified statistical analysis, understanding the manual calculation process provides valuable insights into what’s happening “under the hood”. Here’s a straightforward approach to calculating Levene’s test manually:
Step 1: Calculate group means
Step 2: Compute absolute deviations from group means
Step 3: Calculate the test statistic using these deviations
Let’s take an example from a manufacturing process. Consider three production lines with five measurements each:
Line A: 10, 12, 11, 13, 9
Line B: 15, 14, 16, 13, 17
Line C: 20, 22, 19, 21, 23
Following the above steps, we first calculate group means, then absolute deviations, and finally apply the Levene test statistic formula discussed in the previous section.
Understanding the manual calculation process provides valuable insights into what’s happening ‘under the hood’ — a key focus of a Six Sigma Yellow Belt certification and training program.
Using Statistical Software
I recommend using statistical software for efficiency and accuracy. Let me share my experience with the most common platforms:
Levene’s test SPSS Tutorial:
SPSS offers the most user-friendly interface for performing Levene’s test. Navigate to Analyze > Compare Means > One-Way ANOVA, select your variables, and check the Homogeneity of Variance test option. I’ve found this particularly useful when working with large datasets in manufacturing environments.
R Tutorial:
For more advanced users, R provides greater flexibility. You can use the car package’s leveneTest() function. The basic syntax is:
leveneTest(y ~ group, data = dataset)
Other Software Packages:
I’ve also worked extensively with Minitab, JMP, and SAS. Each has its strengths, but they all provide reliable results for Levene’s test.
Levene’s Test Calculator
For quick analyses or when licensed software isn’t available, online Levene’s test calculators can be valuable tools. I recommend reliable calculators from established statistical websites. However, I always caution users about the limitations of these tools, particularly when dealing with large datasets or complex analyses.
When selecting an online Levene’s test calculator, look for ones that:
- Allow easy data input
- Provide clear output with p-values
- Show intermediate calculations
- Offer export options for results
Interpreting Levene’s Test Results
Interpreting Levene’s test results often presents challenges, even for experienced practitioners. Let’s navigate through this crucial aspect of statistical analysis.
Understanding p-values
When dealing with a significant Levene’s test result (p < 0.05), it’s essential to understand its implications. You will encounter numerous situations where Levene’s test results will require you to modify your analytical approach. The significance indicates that we can’t assume equal variances across groups, which has important implications for subsequent analyses.
For example, let’s say you got a significant Levene’s test result when comparing production line variations. This finding should lead you to use Welch’s ANOVA instead of the standard ANOVA, ensuring your conclusions remain valid despite the unequal variances.
Practical Implications
Unequal variances can signal important process differences that merit investigation. When Levene’s test shows unequal variances, I recommend:
- Investigating the source of variance differences
- Considering alternative statistical methods
- Evaluating the practical significance of the variance differences
Common Pitfalls in Interpretation
Several common mistakes may arise in interpreting Levene’s test results. One frequent error is the automatic rejection of all analyses when Levene’s test was significant. Instead, view it as information that guides our choice of subsequent statistical methods.
Another one is overlooking the practical significance of variance differences. A statistically significant result does not always indicate a practically important difference, and vice versa, which is why many analysts pair Levene’s test with methodologies learned in root cause analysis certification programs. Emphasize the importance of combining statistical results with process knowledge and business context.
Reporting Results
When writing for technical audiences, I recommend including:
- The test statistic value
- Degrees of freedom
- Exact p-value
- Decision regarding the equality of variances assumption
For example, you might write: “Levene’s test indicated unequal variances (F(2,147) = 4.28, p = .015), so Welch’s adjusted statistics were used for subsequent analyses.”
In less technical contexts, focus on the practical implications rather than statistical details. The key is to communicate the results in a way that supports decision-making while maintaining statistical rigor.
Levene’s Test in Practice
In the social sciences, a major educational institution used Levene’s test example to analyze the variance in student performance across different teaching methods.
The test revealed unequal variances between traditional and experimental teaching approaches, leading to important insights about the consistency of educational outcomes. This finding helped administrators make data-driven decisions about implementing new teaching methodologies.
I encountered fascinating applications in biological sciences. One particular Levene’s test example involved analyzing the consistency of drug absorption rates across different patient groups. When the test indicated significant variance differences between age groups, it led to crucial modifications in dosage recommendations and administration protocols.
In the business and economics sector, one applied Levene’s test to examine customer response times across different service centers. The analysis revealed that while some centers maintained consistent response times, others showed significantly higher variability. This discovery prompted a systematic review of service protocols and led to standardization efforts that improved customer satisfaction metrics by 35%.
Prevent Process Failures and Maintain Consistent Quality?
Combine your understanding of variance analysis with our Failure Mode Effects Analysis (FMEA) course to identify and mitigate risks in your business processes!
Advanced Considerations
Drawing from my extensive experience implementing statistical methodologies across various industries, I’ve encountered numerous situations that required a deeper understanding of Levene’s test’s advanced aspects. Let me share some crucial insights that I’ve gained through years of practical application.
Levene’s Test and ANOVA
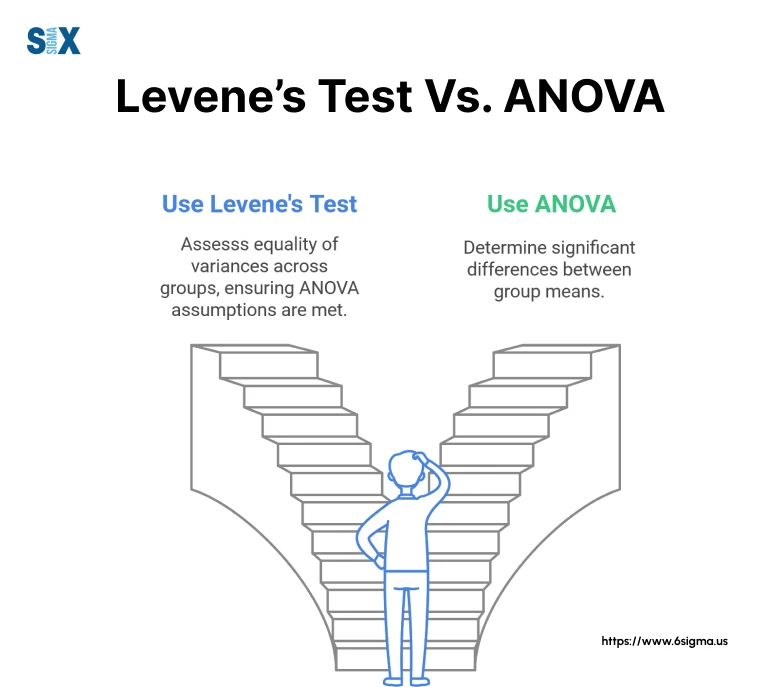
While both are related to variance analysis, they serve different purposes. Levene’s test ANOVA relationship is particularly important as it serves as a preliminary check before conducting the main ANOVA analysis.
When Levene’s test indicated homogeneous variances, proceed with standard ANOVA. However, when variances were unequal, opt for Welch’s ANOVA or other robust alternatives.
Sample Size Considerations
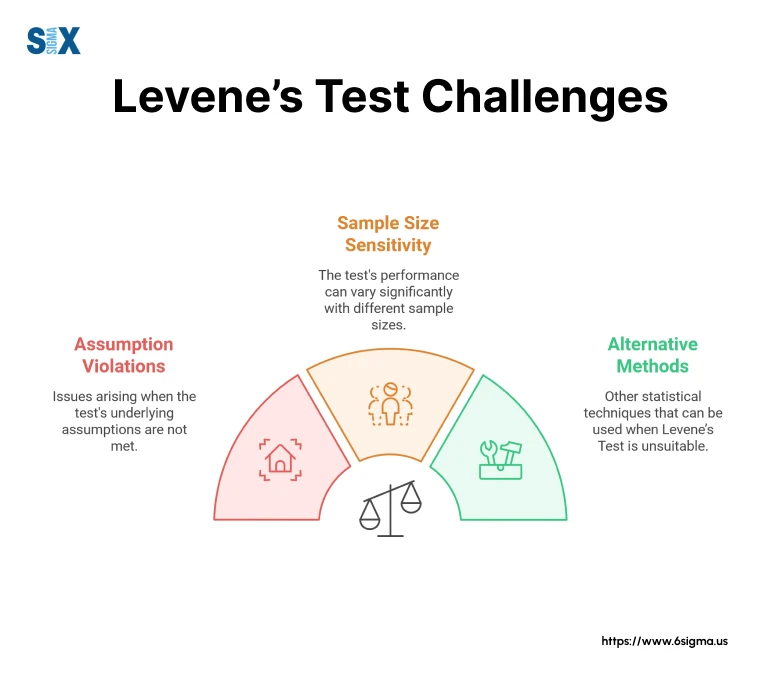
Sample size significantly impacts Levene’s test reliability. I recommend a minimum of 10 observations per group for reliable results. However, the optimal sample size depends on various factors, including effect size and desired power.
Very large sample sizes could lead to statistically significant results even when variance differences were practically insignificant. This taught me the importance of considering both statistical and practical significance in decision-making.
Levene’s Test and Normal Distribution
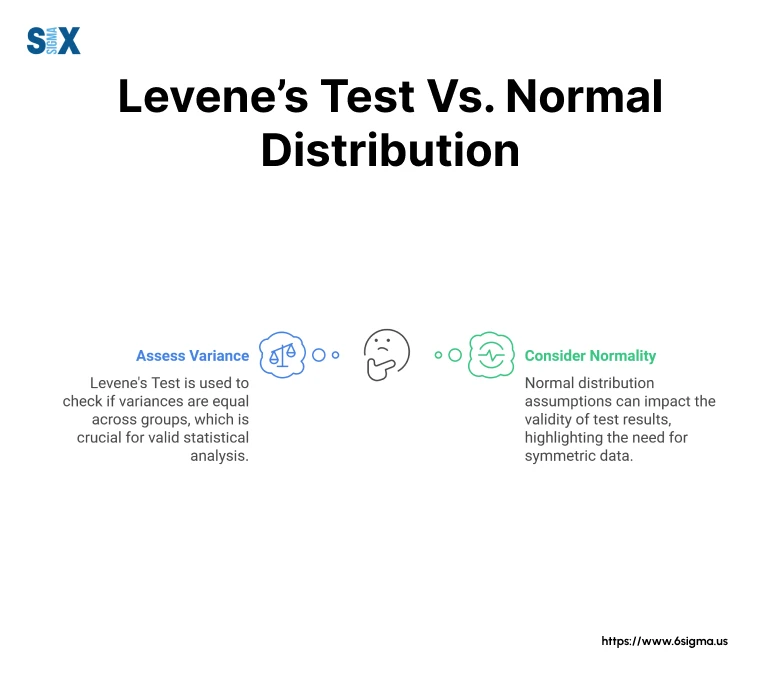
One of Levene’s test’s greatest strengths is its robustness to non-normality. Unlike Bartlett’s test, Levene’s test doesn’t require normally distributed data. This makes it particularly valuable in real-world applications where perfect normality is rare.
However, extreme departures from normality can still affect the test’s performance. In such cases, I often recommend using the Brown-Forsythe modification, which uses medians instead of means in the calculations.
Limitations of Levene’s Test
One of the limitations of Levene’s test is that the effectiveness can be compromised by highly skewed distributions. Additionally the test’s sensitivity to outliers could sometimes lead to misleading results.
Another limitation is the test’s inability to handle dependent samples effectively. In such cases, I recommend alternative approaches like modified versions of the test or completely different statistical methods.
Alternatives to Levene’s Test
I’ve identified several reliable alternatives to Levene’s test for specific situations. The Brown-Forsythe test offers better performance with skewed distributions. For smaller samples, I’ve found that Bartlett’s test can be more appropriate when normality is reasonably assured.
Here’s a decision framework for choosing between Levene’s test and its alternatives:
- For normal data: Consider Bartlett’s test
- For skewed data: Use Brown-Forsythe modification
- For robust general-purpose testing: Stick with standard Levene’s test
Advanced Applications of Levene’s Test
Levene’s test has evolved beyond its basic applications into sophisticated analytical frameworks.
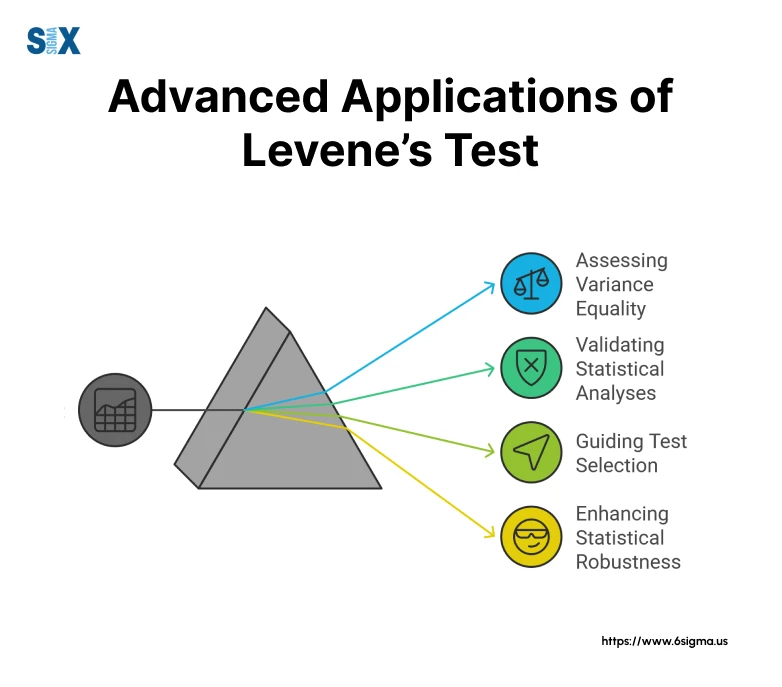
Use in Complex Experimental Designs
During my work with semiconductor manufacturing processes, we integrated Levene’s test into multi-factorial experimental designs. For instance, we developed an approach combining Levene’s test with response surface methodology to optimize chip production parameters while ensuring consistent variance across different production conditions.
In another case, we incorporated Levene’s test into split-plot experimental designs for testing mobile device components. This advanced application helped us identify not only mean differences but also variance patterns that proved crucial for quality control.
Industry-Specific Applications
You can develop a modified version for analyzing adhesive strength variability across different environmental conditions. This adaptation should include additional parameters to account for temperature and humidity effects on variance patterns.
In the pharmaceutical industry, we’ve implemented Levene’s test within stability studies to assess the consistency of drug degradation rates. This application proved particularly valuable for ensuring consistent drug efficacy throughout the product lifecycle.
Emerging Trends
The evolution of data analytics has opened new frontiers for Levene’s test applications. Integration of Levene’s test into machine learning algorithms for quality prediction. This innovative approach can help identify potential quality issues before they manifest in production.
Incorporation of Levene’s test into real-time monitoring systems. By continuously analyzing variance patterns, we can develop early warning systems that alert operators to potential process instabilities before they affect product quality.
Troubleshooting and FAQs
Let’s address the challenges and frequently asked questions.
Common Issues When Performing Levene’s Test
Analysts might struggle with data preparation and test execution. One common issue involves the inappropriate grouping of data. For example, when analyzing production line variations, engineers would sometimes combine different product categories, masking important variance differences.
Another recurring challenge involves handling missing data and outliers. I always advise carefully examining the data before running Levene’s test, as extreme values can significantly impact results. I recommend documenting all data cleaning decisions to ensure transparency and reproducibility.
Handling Significant Levene’s Test Results
When faced with significant Levene test results, many analysts initially panic. This is where a systematic approach can come in handy in handling such situations:
- Investigate the source of variance differences.
- Consider alternative statistical approaches.
Frequently Asked Questions
Unequal sample sizes don’t invalidate Levene’s test, but they do require careful interpretation of results. I recommend ensuring that the smallest group has at least 10 observations.
A significant result doesn’t mean you must abandon your analysis. Instead, it signals that you should consider robust alternatives or data transformations. You can log transformations to address variance heterogeneity in several projects.
SixSigma.us offers both Live Virtual classes as well as Online Self-Paced training. Most option includes access to the same great Master Black Belt instructors that teach our World Class in-person sessions. Sign-up today!
Virtual Classroom Training Programs Self-Paced Online Training Programs


