Kruskal-Wallis Test: Statistical Analysis For Six Sigma Projects
The Kruskal-Wallis test serves as a statistical method for comparing three or more independent groups in Six Sigma projects.
This non-parametric test helps analyze process variations, quality metrics, and performance indicators across different operational segments.
Key Highlights
- Statistical process control implementation methods
- Non-parametric data analysis techniques
- Quality improvement measurement approaches
- Cross-group performance evaluation systems
What Is The Kruskal-Wallis Test?
The Kruskal-Wallis test functions as a statistical method developed by William Kruskal and Wilson Wallis in 1952.
This non-parametric test determines whether independent groups differ significantly from each other.
Statistical teams use it when analyzing three or more groups, particularly when data doesn’t meet the requirements for traditional parametric tests like ANOVA.
Historical Development And Evolution of Kruskal-Wallis Test
The test emerged from the need to analyze data that didn’t follow normal distribution patterns.
Before the Kruskal-Wallis test, researchers struggled to compare multiple groups without relying on strict parametric assumptions.
This statistical innovation provided a robust method for analyzing ranked data, making it invaluable for quality control and process improvement initiatives.
Statistical Process Improvement Applications
Modern quality control departments rely on the this test to evaluate manufacturing processes, compare supplier performance, and assess service delivery standards.
The test transforms raw data into ranks, eliminating the impact of outliers and extreme values that often plague industrial datasets.
For example, production managers might use this test to compare defect rates across different manufacturing shifts.
The test helps determine whether observed differences represent genuine variations or random fluctuations, guiding decisions about process adjustments and resource allocation.
Data-Driven Decision Making Framework
The test supports evidence-based decision making through several key mechanisms. First, it provides a statistical foundation for comparing group medians without assuming normal distributions.
Second, it accommodates both continuous and ordinal data types, making it versatile for various business scenarios.
Third, it offers a reliable method for detecting differences that might not be apparent through simple visual inspection.
Quality engineers often implement the Kruskal-Wallis test when:
- Analyzing process outputs across multiple production lines
- Evaluating equipment performance under different conditions
- Comparing customer satisfaction scores across service centers
- Assessing training program effectiveness across departments
Statistical Significance And Business Impact of Kruskal-Wallis Test
The test generates an H-statistic, which measures the degree of difference between groups. This value helps teams determine whether variations warrant process changes or further investigation.
When the test reveals significant differences, organizations can focus resources on understanding and addressing the root causes of these variations.
The Kruskal-Wallis test maintains its relevance in modern statistical analysis through integration with digital tools and software packages.
These technological advances have simplified the calculation process while preserving the test’s mathematical rigor and reliability.
Theoretical Foundation Of The Kruskal-Wallis Test
The Kruskal-Wallis test builds upon fundamental statistical principles that enable analysis without requiring normal distribution assumptions.
This test transforms raw measurements into ranks, allowing statistical comparisons between multiple independent groups while maintaining analytical rigor.
Non-Parametric Testing Principles
The Kruskal-Wallis test operates on non-parametric principles, making it suitable for data that doesn’t follow normal distribution patterns.
Unlike parametric tests, this method analyzes ranked data rather than raw values. The ranking process transforms measurements into ordinal data, enabling statistical comparisons without assuming specific distribution shapes.
Statistical teams value non-parametric tests because they handle skewed data, outliers, and unequal variances effectively.
The Kruskal-Wallis test maintains statistical power even when traditional assumptions fail, making it particularly useful in real-world applications where data rarely follows perfect theoretical patterns.
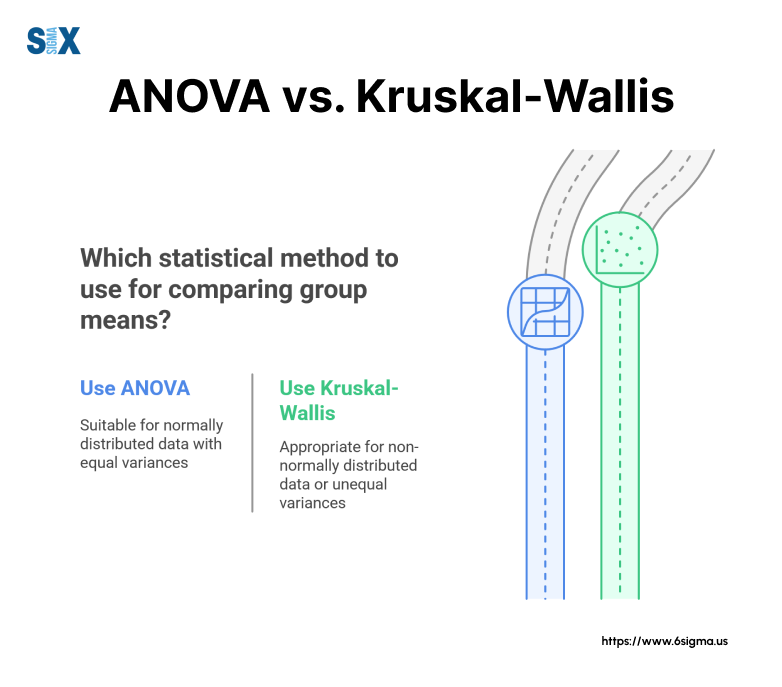
Comparison of Kruskal-Wallis Test with Parametric Tests
While ANOVA serves as the parametric equivalent of the Kruskal-Wallis test, several key differences affect their application.
ANOVA requires normally distributed data, homogeneity of variances, and continuous measurements. The Kruskal-Wallis test relaxes these requirements, offering greater flexibility in data analysis.
The trade-off between these methods involves statistical power and assumption requirements.
ANOVA provides more statistical power when its assumptions are met, but the Kruskal-Wallis test offers reliable results across a broader range of data conditions.
This flexibility proves valuable in Six Sigma projects where data often deviates from ideal conditions.
Mathematical Framework In Six Sigma
The mathematical foundation of the Kruskal-Wallis test centers on rank-based calculations. The test statistic H follows a chi-square distribution with degrees of freedom equal to the number of groups minus one.
This relationship enables statistical inference about group differences without requiring specific population parameters.
The formula for the H statistic incorporates:
- Total sample size
- Individual group sizes
- Rank sums for each group
- Correction factors for tied ranks
Six Sigma Applications And Calculations of Kruskal-Wallis Test
In Six Sigma projects, the Kruskal-Wallis test helps evaluate process improvements across multiple conditions.
Quality engineers use the test to:
- Compare process capabilities between production lines
- Evaluate supplier performance metrics
- Analyze customer satisfaction scores
- Assess training program effectiveness
The calculation process involves several steps:
- Ranking all observations together
- Computing rank sums for each group
- Calculating the H statistic
- Determining statistical significance
Statistical Software Integration
Modern statistical software packages automate these calculations, reducing computational burden while maintaining accuracy.
These tools generate detailed reports including:
- H statistic values
- Degrees of freedom
- P-values
- Mean ranks per group
- Post-hoc comparisons when needed
The theoretical foundation of the Kruskal-Wallis test supports its practical application in quality improvement initiatives.
Understanding these principles helps analysts select appropriate statistical methods and interpret results accurately within the Six Sigma framework.
Transform your statistical skills into leadership excellence with Six Sigma Champion – Leadership Program
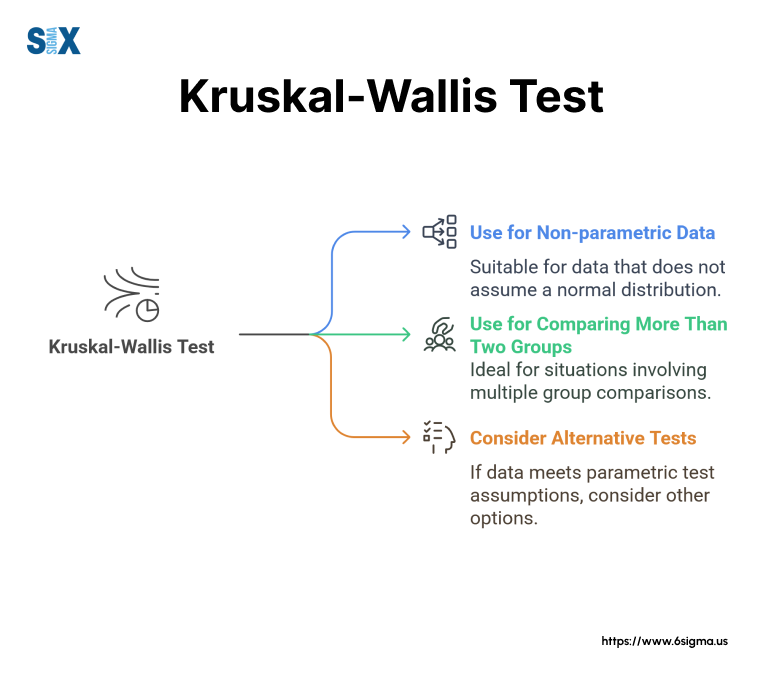
When To Use Kruskal-Wallis Test In Six Sigma
Six Sigma practitioners frequently encounter situations where traditional parametric tests fail to meet required assumptions.
The Kruskal-Wallis test serves as a robust alternative for comparing three or more independent groups, particularly when dealing with non-normal data distributions or when sample sizes differ across groups.
Scenarios Requiring Non-Parametric Analysis
Six Sigma projects often encounter data that violates traditional statistical assumptions
The Kruskal-Wallis test proves valuable when analyzing process metrics that show skewed distributions, contain outliers, or display unequal variances.
Quality engineers typically select this test for comparing three or more independent groups of data that fail normality tests.
Manufacturing environments frequently generate such non-normal data through:
- Cycle time measurements across different shifts
- Defect counts from multiple production lines
- Customer satisfaction ratings from various service points
- Equipment performance metrics under different conditions
Limitations Of Traditional ANOVA
While ANOVA remains popular in statistical analysis, several limitations restrict its use in real-world applications.
ANOVA assumes normal distribution, homogeneity of variance, and independent observations.
These requirements often prove unrealistic in manufacturing and service environments where data naturally deviates from these ideal conditions.
The Kruskal-Wallis test overcomes these limitations by:
- Working with ranked data instead of raw values
- Handling non-normal distributions effectively
- Maintaining reliability despite unequal variances
- Accommodating both continuous and ordinal data
Decision-Making Framework For Test Selection
Selecting between ANOVA and the Kruskal-Wallis test requires careful consideration of data characteristics and project requirements. Quality engineers should evaluate:
Data Distribution Pattern
Normal probability plots and distribution tests help determine whether data follows a normal distribution. When significant deviations appear, the Kruskal-Wallis test offers a more reliable alternative.
Sample Size Considerations
Small sample sizes often produce non-normal distributions. The Kruskal-Wallis test maintains statistical validity even with limited data points, making it suitable for pilot studies and initial process evaluations.
Measurement Scales
While ANOVA requires continuous data, the Kruskal-Wallis test handles both continuous and ordinal measurements. This flexibility proves particularly useful when analyzing customer feedback or quality ratings.
Process Stability
Unstable processes may generate outliers or shifting distributions. The Kruskal-Wallis test’s rank-based approach minimizes the impact of extreme values on statistical conclusions.
Implementation Guidelines for Kruskal-Wallis Test
Before applying the Kruskal-Wallis test, ensure:
- Groups are independent of each other
- Observations within each group are random samples
- The measurement scale allows meaningful ranking
- Sample sizes provide adequate statistical power
Software And Tools
Modern statistical software packages offer built-in functions for conducting the Kruskal-Wallis test.
These tools streamline the analysis process by:
- Automatically checking test assumptions
- Computing rank transformations
- Generating statistical reports
- Providing graphical visualizations
The Kruskal-Wallis test serves as a robust alternative when data characteristics prevent the use of parametric methods.
Understanding these application scenarios helps Six Sigma practitioners select appropriate statistical tools for their process improvement projects.
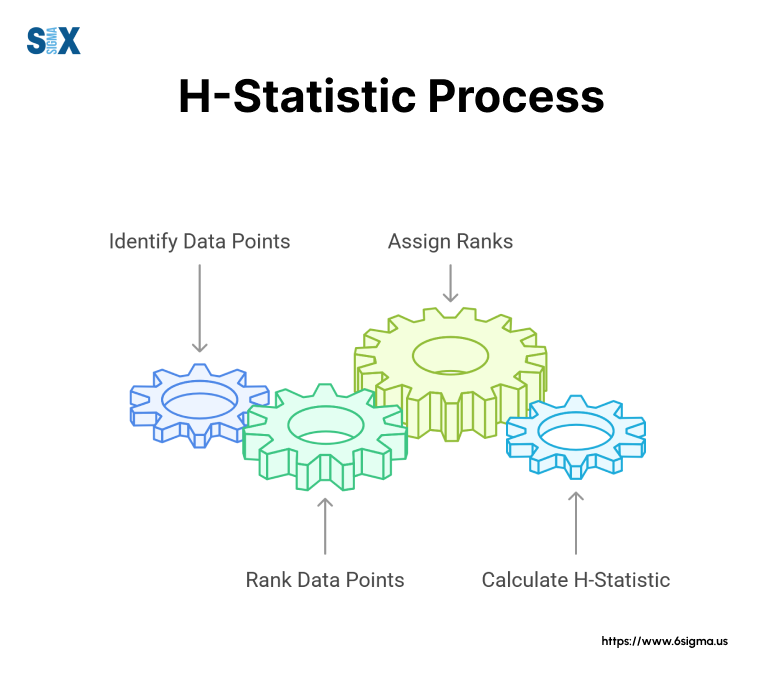
Detailed Calculation Methodology For Kruskal-Wallis Test
The Kruskal-Wallis test calculation follows a systematic process that converts raw data into meaningful statistical conclusions.
Step-By-Step Calculation Process
The Kruskal-Wallis test calculation follows a structured approach that transforms raw data into meaningful statistical conclusions.
The process begins with organizing data into distinct groups and proceeds through ranking, calculation, and interpretation phases.
Initial Data Organization
First, arrange the data into separate columns representing each group under comparison.
Each observation must belong to only one group, maintaining independence between samples. For example, when comparing three manufacturing lines, create separate columns for each line’s quality measurements.
Ranking Procedure
Convert raw measurements to ranks by ordering all observations from smallest to largest, ignoring group membership.
Assign rank 1 to the smallest value, rank 2 to the next smallest, and continue until reaching the largest value. When tied values occur, assign the average of the ranks they would have received if they differed slightly.
Test Statistic Calculation
The H-statistic calculation uses the following formula:
H = [12/N(N+1)] * Σ(Ri²/ni) – 3(N+1)
Where:
N = Total number of observations
Ri = Sum of ranks for each group
ni = Number of observations in each group
Hypothesis Testing Framework
- Null Hypothesis (H0): All groups come from the same population
- Alternative Hypothesis (H1): At least one group comes from a different population
Critical Value Determination
Compare the calculated H-statistic to the critical value from the chi-square distribution table. Use degrees of freedom (df) = number of groups – 1, and your chosen significance level (typically 0.05).
Practical Example of Kruskal-Wallis Test With Calculations
Consider three production lines with quality measurements:
Line A: 23, 25, 28
Line B: 19, 22, 24
Line C: 26, 29, 30
Step 1: Combined Ranking
19(1), 22(2), 23(3), 24(4), 25(5), 26(6), 28(7), 29(8), 30(9)
Step 2: Group Rankings
Line A: 3, 5, 7 (Sum = 15)
Line B: 1, 2, 4 (Sum = 7)
Line C: 6, 8, 9 (Sum = 23)
Step 3: H-Statistic Calculation
Interpretation Guidelines
The calculated H-value leads to one of two conclusions:
- Reject H0 if H exceeds the critical value
- Fail to reject H0 if H falls below the critical value
Software Implementation
Modern statistical packages automate these calculations through built-in functions:
- R: kruskal.test()
- SPSS: Nonparametric Tests > K Independent Samples
- Minitab: Stat > Nonparametrics > Kruskal-Wallis
These tools generate:
- H-statistic value
- Degrees of freedom
- P-value
- Mean ranks per group
- Tied rank adjustments
Six Sigma Project Applications Of The Kruskal-Wallis Test
Manufacturing Quality Control Applications
Manufacturing environments frequently employ the Kruskal-Wallis test to evaluate process performance across multiple production lines.
Quality engineers analyze defect rates, cycle times, and product specifications to identify significant variations between different manufacturing units.
Production line monitoring requires constant evaluation of process metrics. The Kruskal-Wallis test helps identify whether observed differences represent genuine variations or random fluctuations.
For example, when comparing defect rates across three shifts, the test determines if any shift performs significantly different from others.
Quality metrics commonly analyzed include:
- First-pass yield rates
- Scrap percentages
- Machine downtime duration
- Process capability indices
Healthcare Process Improvement Initiatives
Healthcare organizations implement the Kruskal-Wallis test to analyze patient outcomes and treatment effectiveness.
The non-parametric nature of this test proves particularly valuable when dealing with subjective ratings and non-normally distributed health metrics.
Patient satisfaction scores often follow non-normal distributions, making the Kruskal-Wallis test ideal for comparing different departments or treatment protocols. Healthcare analysts examine:
Treatment Duration Analysis
Medical teams compare recovery times across different treatment methods, accounting for various patient conditions and intervention approaches.
Patient Outcome Evaluation
Hospitals track and compare outcome metrics between different units, helping identify best practices and areas needing improvement.
Resource Utilization Studies
Healthcare administrators analyze staff efficiency and resource allocation across different departments using the Kruskal-Wallis test to optimize operations.
Service Industry Performance Metrics
Service organizations utilize the Kruskal-Wallis test to evaluate performance across different service channels and locations.
Customer satisfaction ratings, response times, and service quality metrics often require non-parametric analysis methods.
Call Center Performance
Organizations compare multiple call center locations by analyzing:
- Customer satisfaction ratings
- Call resolution times
- First-call resolution rates
- Agent performance metrics
Retail Operations
Store performance comparisons include:
- Customer feedback scores
- Transaction processing times
- Staff efficiency ratings
- Inventory turnover rates

Implementation Success Factors of Kruskal-Wallis Test
Successful application of the Kruskal-Wallis test in Six Sigma projects requires:
Data Collection Protocols
Establish standardized measurement systems across all comparison groups to ensure data consistency and reliability.
Sample Size Planning
Determine appropriate sample sizes for each group to maintain statistical power while considering resource constraints.
Documentation Requirements
Maintain detailed records of test conditions, measurement procedures, and analysis parameters for future reference and process improvement.
Results Integration And Action Planning
The Kruskal-Wallis test results guide improvement initiatives through:
- Identification of significant performance variations
- Prioritization of improvement opportunities
- Development of targeted action plans
- Monitoring of improvement effectiveness
Organizations use these insights to allocate resources effectively and implement data-driven process improvements across different operational areas.
Become a certified process improvement leader with Six Sigma Champion – Leadership Program
Practical Implementation Guide For Kruskal-Wallis Test
SPSS Implementation
SPSS provides a straightforward interface for conducting the Kruskal-Wallis test.
Navigate to Analyze > Nonparametric Tests > Independent Samples. Select variables and specify grouping factors. The output includes test statistics, degrees of freedom, and significance levels.
R Programming
R users implement the Kruskal-Wallis test using the kruskal.test() function. The basic syntax requires a formula specifying the response variable and grouping factor:
r

kruskal.test(response ~ group, data = dataset)

data_analysis <- kruskal.test(values ~ treatment, data = experiment_data)

print(data_analysis)
Python Implementation
Python’s scipy library contains the kruskal() function for performing the test:
python

from scipy import stats

stats.kruskal(group1, group2, group3)

result = stats.kruskal(data1, data2, data3)

print(result.statistic, result.pvalue)
Result Interpretation Guidelines
Statistical Output Analysis
The test generates several key outputs:
- H-statistic value
- Degrees of freedom
- P-value
- Mean ranks per group
Decision Rules
P-value interpretation follows standard statistical guidelines:
- P < 0.05: Reject null hypothesis
- P ≥ 0.05: Fail to reject null hypothesis
Common Implementation Pitfalls of Kruskal-Wallis Test
Data Preparation Issues
- Missing value handling
- Incorrect group assignments
- Inconsistent measurement scales
- Data entry errors
Statistical Assumption Violations
- Dependent samples
- Mixed measurement scales
- Insufficient sample sizes
Learn the tools that top quality engineers use with Minitab Essentials Training
Advanced Insights And Emerging Trends
Wallis test integrates with machine learning workflows through:
Feature Selection
The test helps identify significant variables for predictive modeling by evaluating group differences across multiple features.
Automated Analysis Pipelines
Modern data science platforms incorporate the Kruskal-Wallis test into automated statistical analysis workflows:
python

def automated_analysis(data_groups):

    results = {}

    for feature in features:

        stat, pval = stats.kruskal(*data_groups[feature])

        results[feature] = {'statistic': stat, 'p_value': pval}

    return results
Future Of Statistical Analysis with Kruskal-Wallis Test
Real-Time Processing
Modern systems implement the Kruskal-Wallis test in real-time monitoring:
- Continuous data collection
- Automated statistical testing
- Immediate result visualization
- Dynamic threshold adjustment
Cloud-Based Solutions
Distributed computing platforms enable:
- Large-scale data analysis
- Parallel processing capabilities
- Collaborative statistical analysis
- Remote result access
Advanced Computational Techniques
Bootstrap Methods
Modern implementations incorporate bootstrap techniques to:
- Estimate confidence intervals
- Validate test results
- Handle complex data structures
- Improve statistical power
Bayesian Extensions
Emerging approaches combine the Kruskal-Wallis test with Bayesian methods:
r

# Example of Bayesian implementation

bayesian_kw <- function(data) {

    prior <- set_prior()

    posterior <- compute_posterior(data, prior)

    return(posterior_analysis(posterior))

}
Process Improvement Applications of Kruskal-Wallis Test
Industry 4.0 Integration
Smart manufacturing systems utilize the Kruskal-Wallis test for:
- Real-time quality monitoring
- Automated process adjustment
- Predictive maintenance scheduling
- Performance optimization
Future Development Directions
Emerging capabilities include:
- GPU-accelerated calculations
- Neural network integration
- Quantum computing applications
- Advanced visualization techniques
These developments expand the test’s utility while maintaining its statistical validity.
Organizations implementing these advanced approaches should maintain proper validation procedures and documentation standards.
SixSigma.us offers both Live Virtual classes as well as Online Self-Paced training. Most option includes access to the same great Master Black Belt instructors that teach our World Class in-person sessions. Sign-up today!
Virtual Classroom Training Programs Self-Paced Online Training Programs


