Hypothesis Testing: A Comprehensive Guide with Examples and Applications
A systematic data-driven approach is required to make business decisions, not just gut feelings. This calls for hypothesis testing.
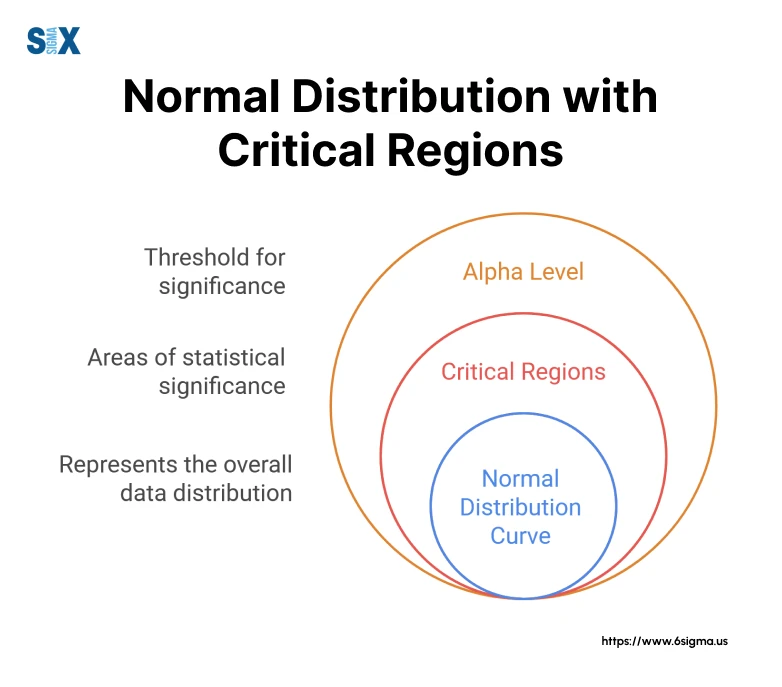
Think of hypothesis testing as your business’s scientific lie detector.
Hypothesis testing is often used in Six Sigma certification to systematically validate process improvements, ensuring decisions are grounded in data rather than intuition.
This article equips you to:
- Validate process improvements
- Make confident business decisions
- Identify significant trends in your data
- Minimize decision-making risks
Breaking the Basics of Hypothesis Testing
A hypothesis, in its simplest form, is a statistically proven statement about a population parameter. For example, a facility’s management team suspects their new coating process was more efficient than the traditional method. Now, let’s prove this.
Now, to prove the hunch right or not, you’ll use; the null hypothesis (H0) and the alternative hypothesis (Ha).
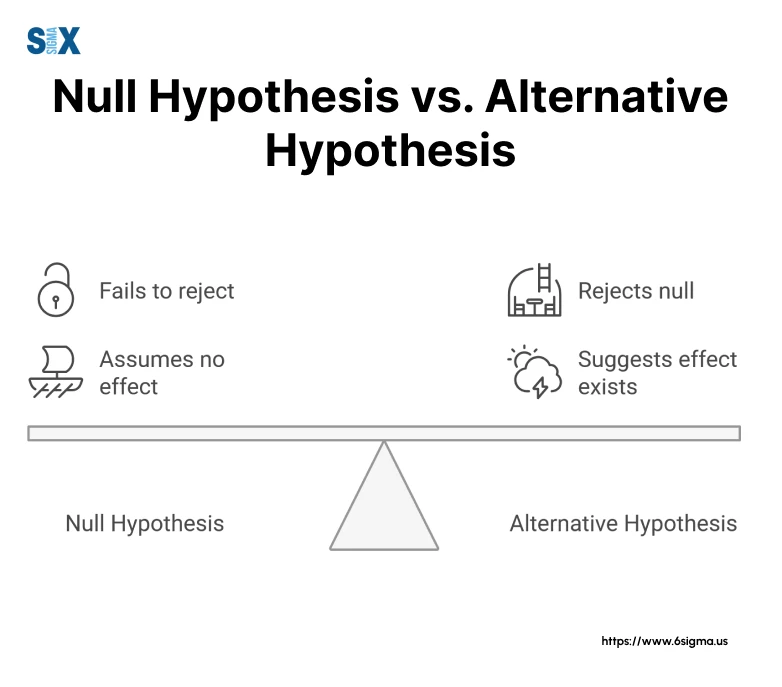
The null hypothesis (H0) represents the current assumption. In our case, H0 stated that “the new coating process is no more efficient than the current process”. Think of H0 as your devil’s advocate – it’s what we assume to be true until we have sufficient statistical evidence to prove otherwise.
The alternative hypothesis (Ha), conversely, represents the claim we want to investigate. In our example, Ha stated that “the new coating process is more efficient than the current process.”
This is typically what we’re trying to prove, but we can never truly “prove” the alternative hypothesis – we can only gather enough evidence to reject the null hypothesis.
Ready to Master Statistical Analysis and Hypothesis Testing?
Join our Lean Six Sigma Green Belt certification instructor-led training to learn critical tools for data-driven decision-making.
The Hypothesis Testing Process: A Master Black Belt’s Step-by-Step Guide
Here’s a systematic approach to hypothesis testing that consistently delivers reliable results. Let me walk you through this process using an example project of a medical device manufacturer, where they need to validate a new sterilization process.
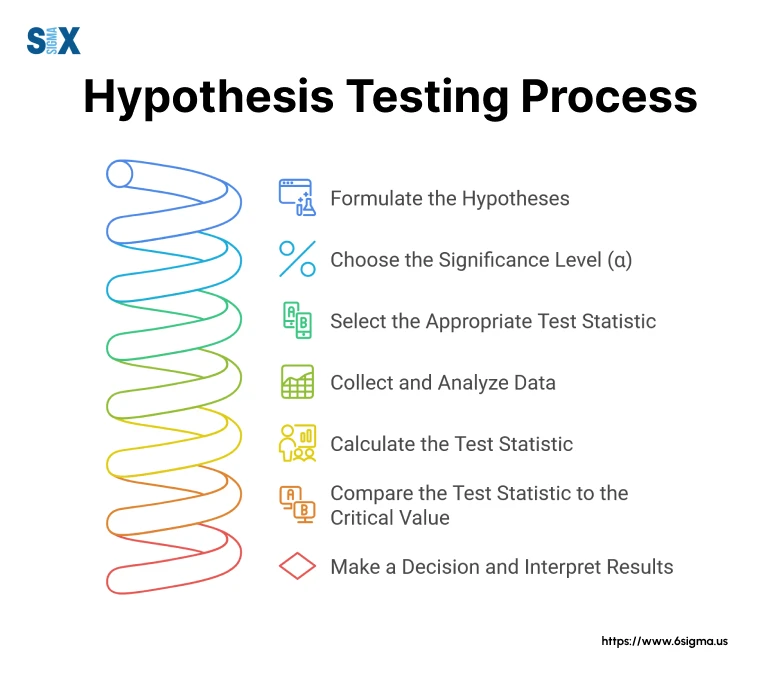
Step 1: Formulate the Hypotheses
First, we clearly define both hypotheses. In the medical device case, our null hypothesis (H0) stated that the new sterilization process was no more effective than the existing one. Our alternative hypothesis (Ha) claimed it was more effective.
Step 2: Choose the Significance Level (α)
Next, we select our risk tolerance. In medical device manufacturing, we typically use α = 0.05 (5% risk), though I’ve used stricter levels (α = 0.01) for critical safety components.
Step 3: Select the Appropriate Test Statistic
Based on your data type and hypotheses, choose the right statistical test. For our sterilization project, we use a two-sample t-test because we are comparing two processes with continuous data.
Step 4: Collect and Analyze Data
Data collection must be methodical and representative. In our case, let’s say we collected sterility data from 100 production runs under both processes.
Step 5: Calculate the Test Statistic
Using statistical software, we compute our test statistic. This transforms our raw data into a single number that will guide our decisions.
Step 6: Compare the Test Statistic to the Critical Value
We compare our calculated value against predetermined critical values.
Step 7: Make a Decision and Interpret Results
Finally, we make our decision to either reject or fail to reject the null hypothesis. In our medical device example, we rejected H0, concluding that the new sterilization process was indeed more effective. However, statistical significance doesn’t automatically mean practical significance.
Six Sigma Green Belt certification trains professionals to apply structured frameworks like this 7-step hypothesis testing process.
Want to Efficiently Perform Hypothesis Tests and Statistical Analysis?
Master Minitab, the essential software for Six Sigma professionals. Equip yourself with practical skills for creating meaningful charts and performing data analysis.
Types of Hypothesis Testing: Choosing the Right Tool for Your Analysis
Selecting the appropriate hypothesis test is like choosing the right tool from a well-equipped toolbox.
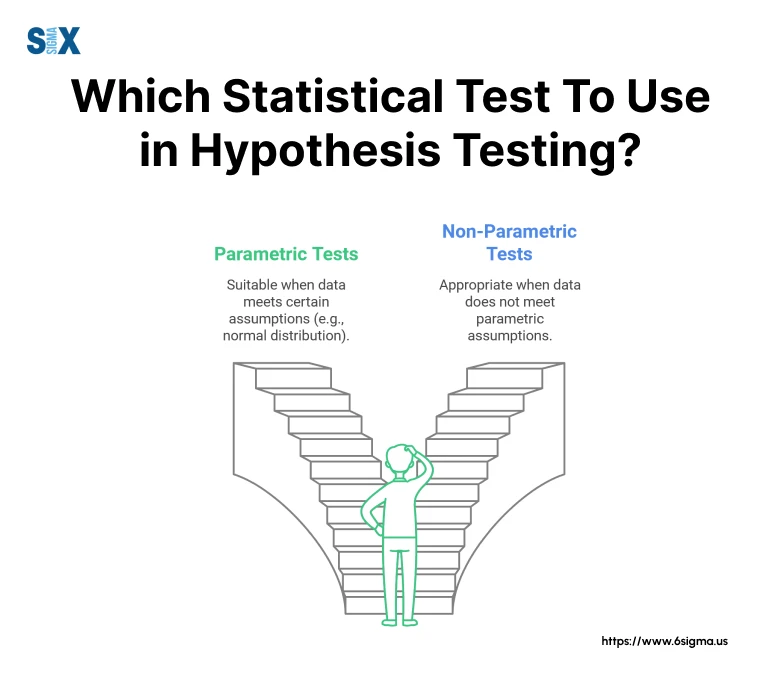
Parametric Hypothesis Testing
Parametric tests are our workhorses when dealing with normally distributed data. Here’s when to use each:
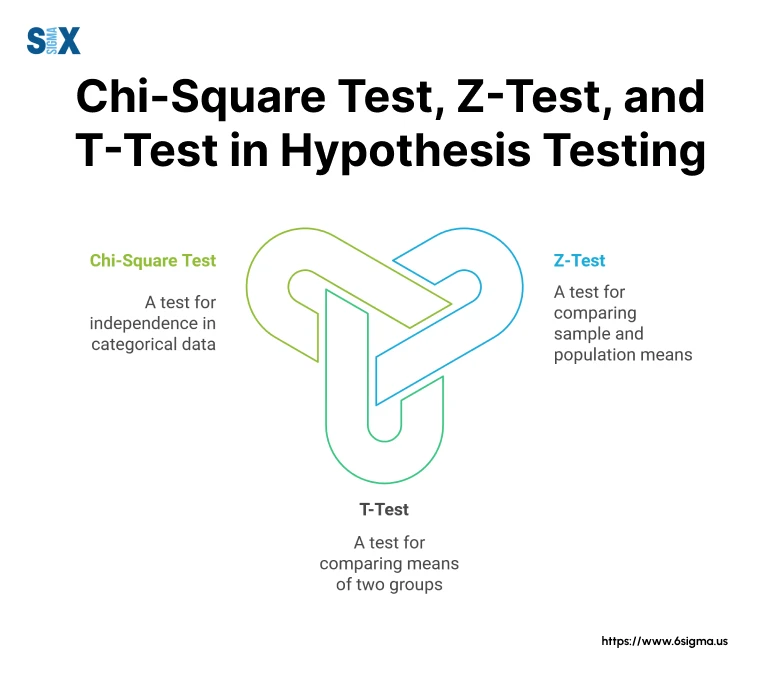
- The Z-test is ideal when you know the population standard deviation and have large sample sizes (n≥30).
- T-tests is a go-to tool when comparing means with smaller sample sizes.
- F-tests and ANOVA (Analysis of Variance) prove crucial when comparing multiple process variations simultaneously.
Non-Parametric Hypothesis Testing
Data isn’t always normally distributed. That’s where non-parametric tests become essential.
The Mann-Whitney U test and Wilcoxon signed-rank tests don’t assume a normal distribution, making them perfect for analyzing time-to-failure data that typically follows other distributions.
Choosing Between Parametric and Non-Parametric Tests
The decision between parametric and non-parametric tests often confuses practitioners. Here’s how to pick one: First, check your data’s distribution. If it’s approximately normal and meets other assumptions (like homogeneity of variance), use parametric tests – they’re generally more powerful. However, if your data is skewed or ordinal, non-parametric tests are your safer bet.
Key Concepts in Hypothesis Testing: Making Sense of Statistical Decision-Making
Throughout my two decades as a Master Black Belt and consultant for companies like Intel and Motorola, I’ve found that understanding key statistical concepts is crucial for making informed business decisions.
Let me break down these essential elements through real-world examples I’ve encountered.
- P-value: The Evidence Metric
The p-value is perhaps the most misunderstood concept in hypothesis testing. Think of the p-value as the probability of seeing your observed results (or something more extreme) if the null hypothesis were true. - Significance Levels: Setting the Decision Threshold
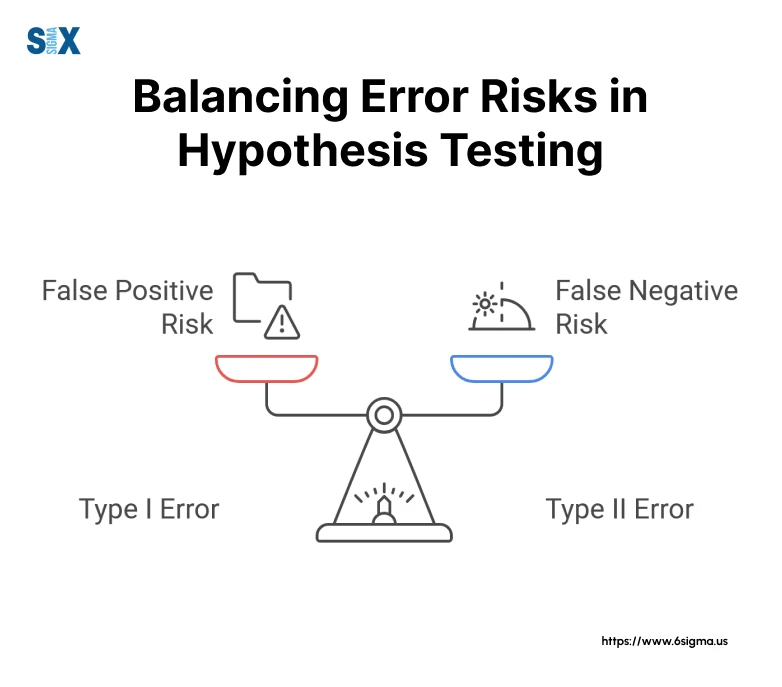
The significance level (α) represents your tolerance for making a false positive decision. Typically α = 0.05 is used, meaning we are willing to accept a 5% risk of incorrectly rejecting the null hypothesis. - Type I and Type II Errors: Understanding Decision Risks
A Type I error (false positive) occurs when we reject a true null hypothesis – like shutting down a perfectly good production line because we wrongly concluded it was producing defects.
A Type II error (false negative) happens when we fail to reject a false null hypothesis – like continuing to run a faulty process because we missed detecting a real problem. - Statistical Power: The Ability to Detect Real Effects
Statistical power represents your test’s ability to detect a genuine effect when it exists. Many organizations underestimate the importance of power analysis. - Confidence Intervals: Quantifying Uncertainty
Rather than just getting a yes/no decision, confidence intervals provide a range of plausible values for the parameter we’re studying. Use 95% confidence intervals to communicate both estimates and their precision to stakeholders.
This helps decision-makers understand not just whether there was a difference, but how large that difference might be.
Mastering these concepts is a cornerstone of Six Sigma certification programs, where practitioners learn to quantify uncertainty and mitigate risks in process optimization
One-Tailed vs. Two-Tailed Tests in Hypothesis Testing: Choosing the Right Direction for Your Analysis
During my extensive work with companies like Intel and Motorola, I’ve noticed that choosing between one-tailed and two-tailed tests often creates confusion, even among experienced professionals. Let me share insights gained from real-world applications that will help clarify this crucial aspect of hypothesis testing.
One-Tailed Tests
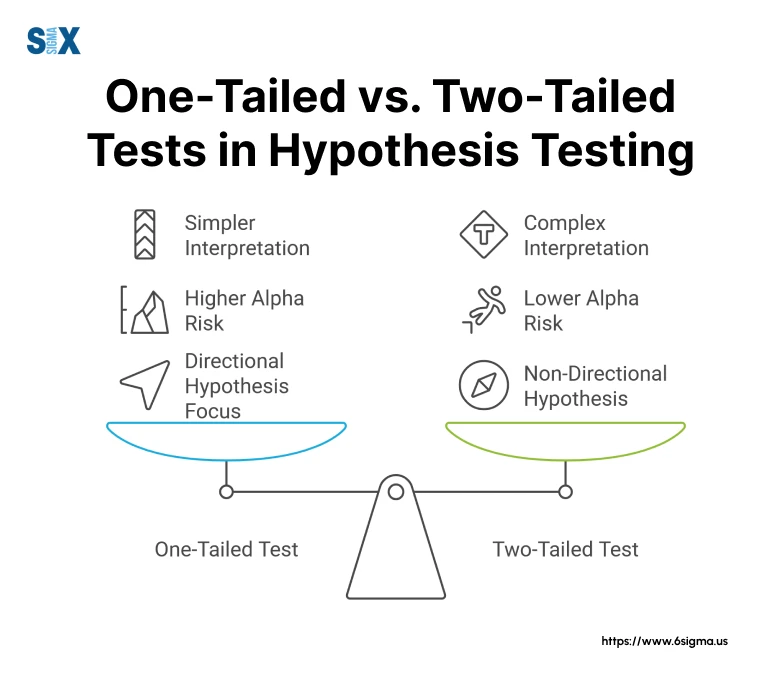
A one-tailed test examines the possibility of a relationship in only one direction. Use one-tailed tests when evaluating process improvements where you want to know if a new method is better than the existing one, not just different.
Two-Tailed Tests: Testing for Differences in Either Direction
Two-tailed tests, on the other hand, examine the possibility of a relationship in both directions. Use two-tailed tests when analyzing equipment calibration changes, as any deviation from the standard – whether higher or lower – was important to detect. This approach provides a more conservative test but offers broader insight into potential differences.
Choosing Between One-Tailed and Two-Tailed Tests
The decision between these approaches isn’t just statistical – it’s strategic. Here’s how you can make this choice:
Use a one-tailed test when:
- You have a specific directional hypothesis based on prior knowledge or theory
- Only one direction of change would be actionable
- You need maximum power to detect an effect in a specific direction
Use a two-tailed test when:
- You’re exploring potential differences without directional assumptions
- Changes in either direction would be meaningful
- You need to guard against unexpected effects in either direction
Example
Let’s take the example of a pharmaceutical manufacturer.
They want to use a one-tailed test to prove their new drug formulation was more effective than the existing one. However, we should use a two-tailed test because:
- Safety regulations require monitoring for any significant changes
- An unexpected negative effect would be just as important to detect
- The additional statistical rigor would strengthen their FDA submission
Hypothesis Testing Formulas and Calculations
Let’s look at the essential formulas and calculations required for hypothesis testing.
Z-Test Formula and Application
The Z-test formula is:
Z = (x̄ – μ)/(σ/√n)
Where:
x̄ = sample mean
μ = population mean
σ = population standard deviation
n = sample size
Apply this formula to validate process improvements. For example:
- Sample mean (x̄) = 2.15mm
- Population mean (μ) = 2.00mm
- Known standard deviation (σ) = 0.1mm
- Sample size (n) = 36
Z = (2.15 – 2.00)/(0.1/√36) = 9.0
T-Test Formula of Hypothesis Testing in Practice
For smaller samples or when the population standard deviation is unknown, I recommend the t-test. You can use:
t = (x̄ – μ)/(s/√n)
Where s represents the sample standard deviation. The key difference from the Z-test is using the sample standard deviation (s) instead of the population standard deviation (σ).
Chi-Square Test Implementation
Use the chi-square test for categorical data analysis:
χ² = Σ((O-E)²/E)
Where:
O = Observed frequency
E = Expected frequency
Excel Implementation of Hypothesis Testing
Here’s a streamlined approach to hypothesis testing in Excel:
1. Data Organization:
First, input your data in columns, clearly labeling variables. You can create templates that simplify this process.
2. Using Excel Functions:
For Z-test: =NORM.S.DIST()
For t-test: =T.TEST()
For chi-square: =CHISQ.TEST()
Quick Tip: While Excel is powerful, always verify critical calculations using specialized statistical software, especially for complex analyses.
Common Mistakes and Pitfalls in Hypothesis Testing
Let’s look at some critical pitfalls and how to avoid them.
Misinterpreting P-values: The Most Common Trap in Hypothesis Testing
The most pervasive mistake is misinterpreting p-values. This fundamental misunderstanding can lead to serious consequences.
Remember: a p-value simply indicates the probability of observing your results (or more extreme) if the null hypothesis were true. It doesn’t tell you the probability that your hypothesis is correct.
Multiple Testing Problems: The Hidden Multiplier
Another critical issue is the multiple testing problem. When conducting numerous hypothesis tests simultaneously, the probability of finding at least one “significant” result by chance alone increases dramatically.
The solution? Use methods like the Bonferroni correction or false discovery rate control.
Ignoring Effect Size: The Practical Significance Gap
Statistical significance doesn’t equal practical importance. Always consider the magnitude of the effect, not just its statistical significance.
Overlooking Statistical Assumptions in Hypothesis Testing
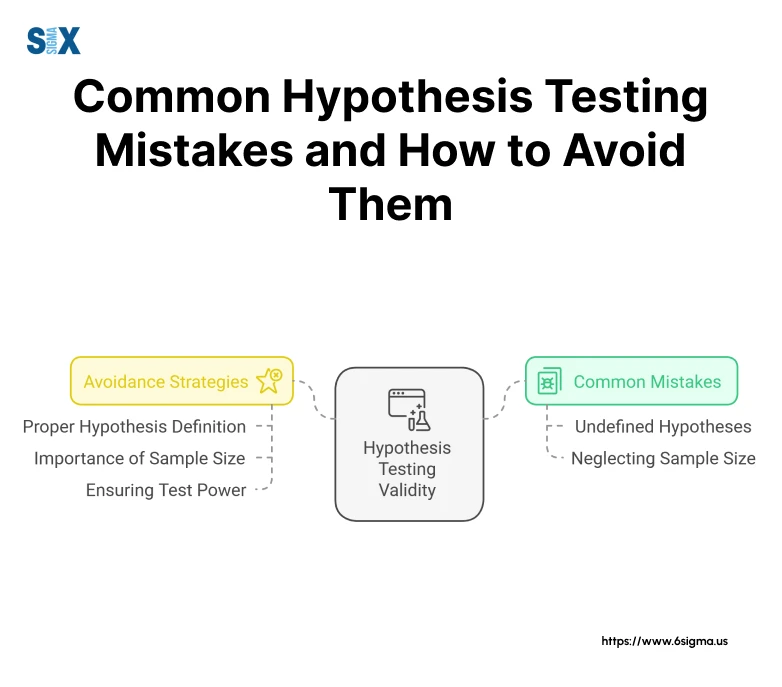
Perhaps the most technically dangerous mistake comes from ignoring the underlying assumptions of statistical tests. Before applying any hypothesis test, verify assumptions about:
- Data distribution (normality when required)
- Independence of observations
- Homogeneity of variance
- Sample size requirements
Prevention Strategies
Here are some advice for avoiding these pitfalls:
- Always state your hypotheses and significance level before collecting data
- Document and verify all statistical assumptions
- Consider practical significance alongside statistical significance
- Use appropriate corrections for multiple testing
- Maintain detailed documentation of your analysis process
Pairing hypothesis testing with root cause analysis training ensures teams address underlying issues, not just symptoms.
Advanced Topics in Hypothesis Testing: Beyond the Basics
Let’s look at some powerful advanced techniques.
Bayesian Hypothesis Testing: A Modern Approach
Bayesian hypothesis testing offers distinct advantages over traditional frequentist methods. Unlike classical hypothesis testing, Bayesian approaches incorporate prior knowledge and update probabilities as new evidence emerges.
Sequential Hypothesis Testing: Real-Time Decision Making
Sequential testing allows for continuous monitoring and decision-making as data accumulates. Use sequential testing to identify issues early, potentially saving millions in preventing defects.
The key advantage is that you can stop testing as soon as you have sufficient evidence, rather than waiting for a predetermined sample size.
Multivariate Hypothesis Testing: Handling Complex Relationships
Problems rarely involve just one variable. Multivariate hypothesis testing allows us to examine multiple dependent variables simultaneously.
For instance, when optimizing printer performance, we should consider print quality, speed, and ink consumption together. Using multivariate analysis of variance (MANOVA), to identify optimal settings that balance all these factors effectively.
Resampling Methods: Modern Computing Power at Work
Bootstrap and permutation tests have revolutionized how we handle non-standard data distributions. Use bootstrap methods to analyze reliability data that didn’t meet traditional normality assumptions. These techniques provide robust results without requiring the strict assumptions of classical methods.
Examples: Hypothesis Testing in Action
Let’s look at some examples that demonstrate different hypothesis-testing approaches.
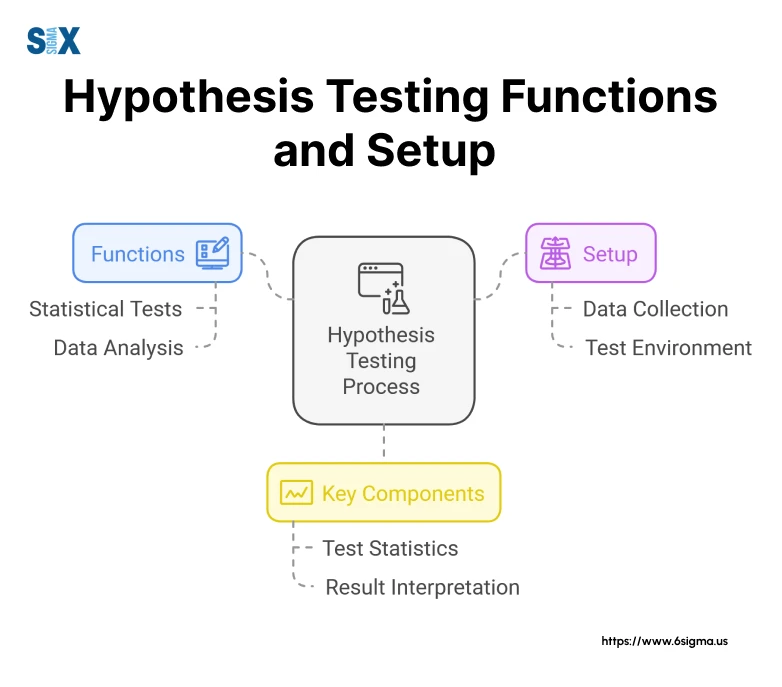
Example 1: Z-test for Population Mean
Suppose, we needed to verify if a new microprocessor manufacturing process met specifications. Here’s how to approach it:
Problem: Processor clock speed needed to maintain 3.2 GHz with a known standard deviation of 0.1 GHz
H0: μ = 3.2 GHz
Ha: μ ≠ 3.2 GHz
Sample size: 36 processors
Sample mean: 3.18 GHz
Calculation:
Z = (3.18 – 3.2)/(0.1/√36) = -1.2
With α = 0.05 and critical value = ±1.96, we failed to reject H0, concluding the process met specifications.
Example 2: T-test for Comparing Two Group Means
Suppose, we’re comparing two formulations:
Problem: Compare bond strength between new and current formulations
H0: μ1 – μ2 = 0
Ha: μ1 – μ2 > 0
Sample sizes: n1 = n2 = 15
Results:
New formulation: x̄1 = 95.2 PSI, s1 = 4.2
Current formulation: x̄2 = 92.1 PSI, s2 = 4.5
The t-test yielded p = 0.032, leading us to reject H0 and implement the new formulation, resulting in a 3.4% strength improvement.
Example 3: Chi-square Test for Independence
Let’s investigate the relationship between customer satisfaction and product type:
Problem: Determine if satisfaction levels varied by product category
Data: 500 customer surveys across laptops, desktops, and tablets
χ² calculation = 15.6, df = 4
Critical value (α = 0.05) = 9.49
Since 15.6 > 9.49, we rejected H0, revealing significant differences in satisfaction across product lines, leading to targeted improvement initiatives.
Example 4: ANOVA for Comparing Multiple Group Means
Let’s evaluate three different training methods:
Problem: Compare the effectiveness of traditional, online, and hybrid training
H0: All means equal
Ha: At least one mean differs
Sample size: 30 per group
Results:
F-statistic = 8.45
p-value = 0.0003
The significant result led to detailed post-hoc analysis, ultimately showing hybrid training’s superiority, and increasing employee productivity.
Key Interpretation Guidelines:
Here are crucial points for interpreting results:
- Always consider practical significance alongside statistical significance
- Look at effect sizes, not just p-values
- Consider the costs and benefits of potential changes
- Document assumptions and limitations
- Validate results with follow-up studies when possible
Decision-Making Framework Using Hypothesis Testing: A Strategic Approach
You need a robust decision-making framework that transforms hypothesis testing from a statistical exercise into a powerful business tool.
Lean fundamentals, often taught alongside Six Sigma certification programs, emphasize eliminating waste through data-driven insights.
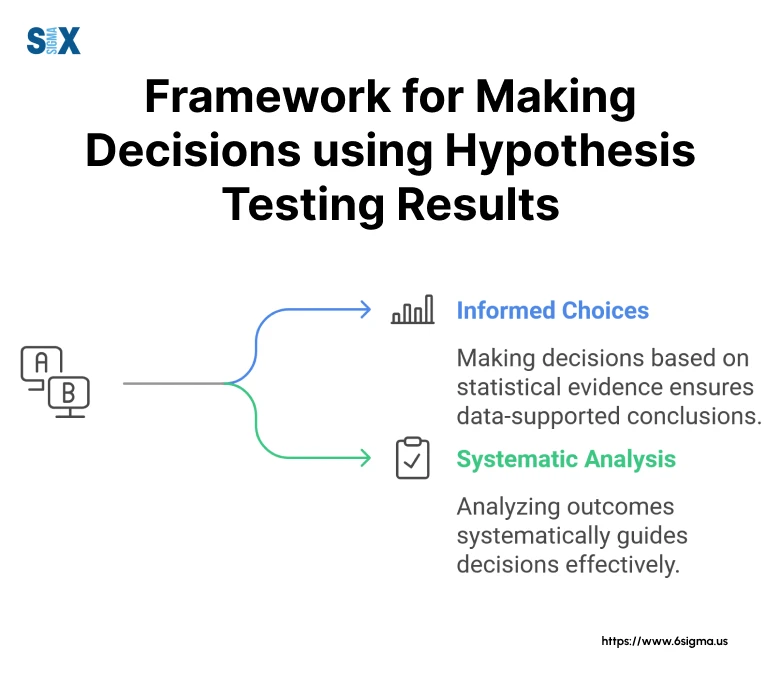
Defining the Problem and Research Question
The foundation of effective hypothesis testing begins with precise problem definition. During my work with an aerospace division, we faced a challenging situation with turbine blade coatings.
Instead of asking broadly “Is the new coating better?” we refined our question to “Does the new coating increase heat resistance by at least 15% under standard operating conditions?” This specificity was crucial for designing an effective testing strategy.
Selecting the Appropriate Test with Hypothesis Testing
Test selection is where many organizations stumble. You can use a decision tree approach that considers three key factors:
- Data type (continuous, categorical, or ordinal)
- Sample size and distribution
- Business constraints and objectives
Interpreting Results in Context with Hypothesis Testing
Statistical significance alone isn’t enough for business decision-making. Implement a comprehensive interpretation framework that considers:
- Statistical results (p-values and confidence intervals)
- The practical significance of observed effects
- Implementation costs and feasibility
- Potential risks and trade-offs
One particularly successful application involved a manufacturing process improvement where, despite achieving statistical significance (p < 0.01), we delayed implementation until conducting additional cost-benefit analyses. This thorough approach ultimately led to a more effective solution that saved the company over $2M annually.
Making Informed Decisions
The final step in our framework transforms statistical insights into actionable business decisions. I recommend a structured approach:
- First, quantify the business impact. Use a matrix that maps statistical results to potential business outcomes, helping stakeholders understand the implications of their decisions.
- Second, consider implementation requirements. Statistically significant improvements sometimes require impractical operational changes. This framework helps identify alternatives that balance statistical evidence with practical constraints.
- Finally, establish monitoring protocols. Implement tracking systems to verify that statistically validated improvements maintain effectiveness over time.
Going Ahead
Hypothesis testing is rapidly evolving with the advent of big data and artificial intelligence. These developments don’t replace the core principles; rather, they enhance our ability to handle larger datasets and more complex scenarios.
The future of hypothesis testing lies in its integration with emerging technologies. Traditional statistical methods can be combined with modern data science approaches. This hybrid approach, allows organizations to maintain statistical rigor while leveraging the power of big data analytics.
Looking ahead, I encourage you to view hypothesis testing not just as a statistical tool, but as a fundamental framework for data-driven decision-making.
Frequently Asked Questions About Hypothesis Testing
Use hypothesis testing to validate process improvements before full-scale implementation. This systematic approach helps organizations distinguish between genuine effects and random variation. For instance, hypothesis testing can help you determine whether observed improvements in yield rates were statistically significant or merely coincidental.
Evaluate the effectiveness of new customer service protocols. Apply it to validate equipment maintenance schedules. The applications are virtually limitless – from pharmaceutical trials to marketing campaign effectiveness, anywhere you need to make decisions based on data.
Use hypothesis testing whenever you need to make an important decision based on sample data. Specifically, consider hypothesis testing when:
– Comparing process or product performance
– Validating improvement initiatives
– Testing new methods or procedures
– Evaluating the impact of changes
– Verifying compliance with specifications
Concluding hypothesis testing requires both statistical rigor and business acumen. Use a structured approach:
1. Compare your test statistic or p-value to predetermined criteria
2. State your statistical conclusion (reject or fail to reject the null hypothesis)
3. Translate statistical results into business implications
4. Recommend specific actions based on the findings
The decision rule is your predetermined criteria for rejecting or failing to reject the null hypothesis. Typically the standard α = 0.05 significance level is used. Meaning we would reject the null hypothesis if our p-value was less than 0.05. However, the appropriate decision rule can vary based on:
– Industry standards and regulations
– Cost of Type I versus Type II errors
– Business risk tolerance
– Practical significance thresholds
For example, use more stringent decision rules (α = 0.01) when working on safety considerations, whereas marketing applications might use more relaxed criteria.
SixSigma.us offers both Live Virtual classes as well as Online Self-Paced training. Most option includes access to the same great Master Black Belt instructors that teach our World Class in-person sessions. Sign-up today!
Virtual Classroom Training Programs Self-Paced Online Training Programs


