Coefficient of Variation: Mastering Relative Variability in Statistics
Grasping and utilizing the coefficient of variation (CV) is hugely important for stats analysis and workflow refinement.
The CV, also called relative standard deviation, is a scale-free stats metric that quantifies how data scatters around the average.
It provides a standardized way to compare variability between data sets, even when the raw units or scales differ greatly.
This flexibility makes the Coefficient of Variation an incredibly useful tool for experts looking to assess and boost the reliability and consistency of their processes, products or services.
Its power to distill complex numbers into a clear, easy-to-grasp metric has proven hugely valuable. When high variability (a high CV) indicates a problem, techniques learned through Root Cause Analysis training are essential for identifying the underlying issues before implementing solutions.
In other words, mastering the CV concept arms you with a mighty understanding and analytical skill. It allows scrutinizing variability to optimize quality and productivity no matter the business or industry.
Key Highlights
- Understanding the mathematical definition and calculation of the CV, including step-by-step examples and Excel implementations.
- Interpreting CV values and determining what constitutes a “good” or acceptable level of variability based on industry standards.
- Examining applications of the CV across various domains.
- Identifying scenarios where the CV is particularly useful, such as comparing groups with vastly different means or measurements.
- Addressing potential limitations and cautions when using the CV.
- Analyzing case studies and examples that illustrate the practical application of the CV in optimizing processes, assessing risk, and driving continuous improvement.
What is the Coefficient of Variation?
This dimensionless ratio, often referred to as the relative standard deviation, provides a powerful tool for quantifying the dispersion of data points around the mean, allowing for meaningful comparisons across different scales and units of measurement.
Calculating the Coefficient of Variation
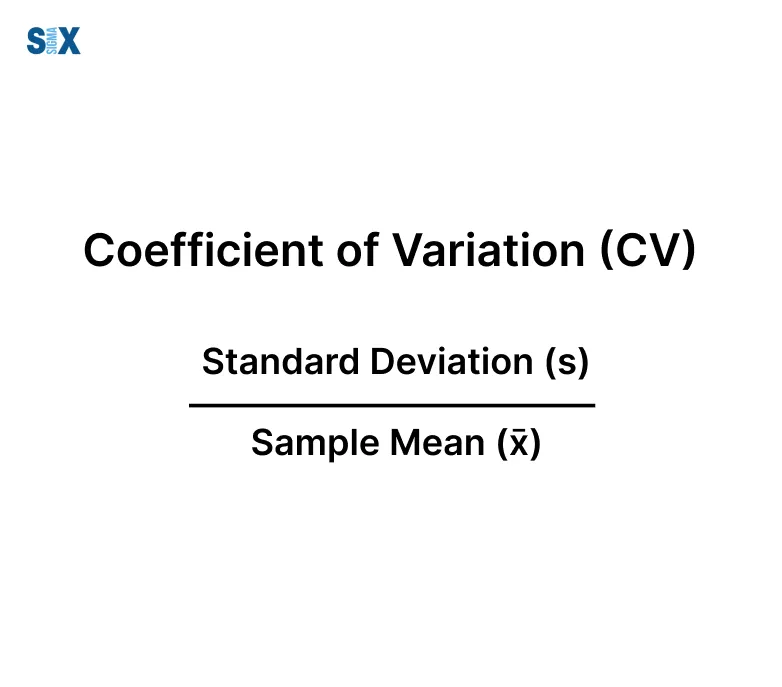
The calculation of the coefficient of variation is straightforward yet profoundly insightful. It involves dividing the standard deviation of a data set by its arithmetic mean, yielding a unitless value that represents the degree of variability relative to the central tendency. Mathematically, the formula can be expressed as:
CV = (Standard Deviation) / (Mean)
For those familiar with Excel, the Coefficient of Variation can be easily computed by first finding the standard deviation (using the STDEV function) and the mean (using the AVERAGE function) of your data set, and then dividing the former by the latter.
Even a basic awareness of metrics like the Coefficient of Variation, often introduced in foundational programs like Six Sigma White Belt certification or Six Sigma Yellow Belt certification, can empower team members to better understand process stability and contribute to quality improvement discussions.
Interpreting Coefficient of Variation Values
The interpretation of the coefficient of variation is intuitive yet nuanced. A higher CV value indicates greater dispersion of data points around the mean, suggesting higher relative variability.
Conversely, a lower CV implies tighter clustering of observations around the central value, signifying lower relative variability.
As a general guideline, a CV less than 1 (or 100% when expressed as a percentage) is considered low variability, while values greater than 1 suggest high variability.
However, it’s crucial to contextualize these values within the specific domain and industry standards, as acceptable levels of variability can vary depending on the process or application.
For instance, in manufacturing environments where precision is paramount, a CV below 0.1 (or 10%) may be deemed acceptable, whereas in financial modeling or risk analysis, a CV exceeding 0.3 (or 30%) could be considered high risk.
It’s also worth noting that when the mean of a data set approaches zero, the coefficient of variation can become sensitive to small fluctuations, potentially leading to misleading or unreliable interpretations.
In such cases, it’s advisable to complement the CV analysis with other statistical measures or subject matter expertise.
When to Use the Coefficient of Variation
While the CV is a powerful tool in any analyst’s arsenal, there are specific scenarios where its unique properties shine, allowing for meaningful comparisons and data-driven decision-making.
Comparing Groups with Vastly Different Means
One of the key strengths of the CV lies in its capacity to compare the relative variability of groups or populations with significantly different mean values.
This is particularly valuable in fields like economics, where assessing income inequality across nations or regions with disparate average incomes is crucial for policy development and resource allocation.
Similarly, in the financial realm, the CV proves invaluable for evaluating the risk-to-reward ratios of investment portfolios spanning various asset classes with widely ranging expected returns.
By accounting for the differences in means, the CV enables investors to make informed decisions based on the relative volatility of their investments, rather than being misled by absolute measures of variability.
Comparing Measurements on Different Scales
Another compelling use case for the CV arises when comparing the variability of measurements that employ different units or scales.
This scenario is not uncommon in fields like engineering, where diverse characteristics such as temperature, speed, weight, and material strength may need to be evaluated simultaneously.
Without the use of a standardized metric like the CV, directly comparing the variability of these disparate measurements would be akin to comparing apples to oranges.
However, by leveraging the dimensionless nature of the CV, practitioners can objectively assess the relative variability of these distinct characteristics, facilitating more informed decision-making and process optimization.
In education, the CV has proven instrumental in comparing the variability of standardized test scores across different assessment tools, such as the SAT and ACT, which employ different scoring scales.
This allows for a more equitable evaluation of student performance and ensures that admissions decisions are based on a comprehensive understanding of the relative variability in test results.
Limitations and Cautions
While the coefficient of variation is an incredibly powerful and versatile statistical tool, it’s important to understand its limitations and exercise caution when interpreting and applying its results.
Means Close to Zero
One significant limitation of the coefficient of variation arises when dealing with data sets where the mean value approaches zero. In such cases, the CV can become extremely sensitive to even minor fluctuations in the mean, potentially leading to misleading or unreliable interpretations.
This is because the mean serves as the denominator in the CV calculation, and as it approaches zero, any small change can result in a disproportionately large impact on the overall ratio.
As a practical example, consider a manufacturing process where the target specification for a critical dimension is 0.0 mm, with a standard deviation of 0.001 mm.
While the standard deviation alone might suggest excellent process control, the resulting CV would be undefined or approach infinity, rendering it essentially meaningless.
In situations like these, it’s advisable to rely on alternative measures of variability or to complement the CV analysis with subject matter expertise and additional context.
Interval Scale Data
Another important caveat when using the coefficient of variation is its applicability to different types of measurement scales.
The CV is specifically designed for use with ratio scale data, where the zero point represents the complete absence of the measured quantity.
Examples of ratio scales include weight, length, and absolute temperature (Kelvin scale).
However, if the data being analyzed is on an interval scale, where the zero point is arbitrary and does not represent a true absence of the characteristic, the CV’s interpretation becomes problematic.
Temperature measurements in Celsius or Fahrenheit, for instance, are interval scales, as a temperature of 0°C or 32°F does not signify the complete lack of thermal energy.
Attempting to calculate and interpret the CV for interval scale data can lead to erroneous conclusions, as the underlying assumptions of the ratio calculations are violated.
In such cases, it’s essential to rely on alternative measures of variability that are appropriate for the scale of measurement or to consider transforming the data to a ratio scale if feasible.
By proactively understanding and addressing these limitations we can ensure that our application of the coefficient of variation remains robust, reliable, and tailored to the specific characteristics of the data at hand, ultimately enabling more informed decision-making and process optimization.
Applications of the Coefficient of Variation
The coefficient of variation’s versatility and applicability extend far beyond the realms of pure statistical analysis, making it a critical tool for professionals with a Six Sigma certification who aim to optimize workflows across industries.
For professionals leading complex process improvement projects, the CV is often paired with advanced statistical techniques. Those with a Six Sigma Black Belt certification leverage these tools to drive organizational change and achieve significant cost savings.
Finance and Investing
In the financial sector, the coefficient of variation has proven invaluable for assessing investment risk and optimizing portfolio allocation.
By comparing the relative volatility of different assets or investment vehicles, investors can make informed decisions that align with their risk tolerance and desired returns.
This is particularly useful when evaluating investments with vastly different expected returns, as the CV accounts for the disparities in means, enabling a more equitable comparison of risk-to-reward ratios.
Research and Analysis
The coefficient of variation’s ability to standardize measurements and facilitate cross-comparisons has made it an indispensable tool in the field of research and analysis.
In economic studies, for instance, the CV is frequently employed to measure income inequality across regions or nations, providing policymakers with crucial insights for resource allocation and program development.
Similarly, in scientific research, the CV plays a pivotal role in comparing the variability of experimental results across different studies or methodologies. This is especially valuable when analyzing data from diverse sources or when working with measurements that employ different units or scales.
Examples and Interpretations
To illustrate the practical application of the coefficient of variation, let’s consider a hypothetical scenario in which a risk-averse investor is evaluating three different exchange-traded funds (ETFs) for potential inclusion in their portfolio.
After analyzing historical data, the investor determines that ETF A has an average annual return of 6% with a standard deviation of 10%, ETF B has an average return of 8% with a standard deviation of 16%, and ETF C has an average return of 5% with a standard deviation of 6%.
By calculating the coefficient of variation for each ETF (CV = standard deviation/mean), the investor can directly compare the relative variability of these investments.
In this case, ETF A would have a CV of 0.167 (10% / 6%), ETF B would have a CV of 0.2 (16% / 8%), and ETF C would have a CV of 0.12 (6% / 5%).
Based on these calculations, the risk-averse investor would likely favor ETF C, as it exhibits the lowest coefficient of variation, indicating a more favorable risk-to-reward ratio compared to the other options.
This exemplifies how the CV can be a powerful decision-making tool, enabling practitioners to cut through complexities and make informed choices based on standardized, objective measures of variability.
Conclusion
Looking back on all we covered, the coefficient of variation’s value stands out from my experience as an analytics vet.
Whether comparing variability between groups with hugely different averages, evaluating metrics on various scales, or assessing financial risk – the CV’s normalization skills have powered my quest for workflow perfection and continual upgrades, often drawing on principles from both Six Sigma and Lean Fundamentals.
That said, no tool is flawless. We must understand CV assumptions and limits, especially around means near zero or interval scale data.
By acknowledging possible pitfalls and adding context from subject knowledge, our analyses stay robust and tailored to variable types.
CV will guide innovation and data-driven choices across industries as tech improves and stats comprehension expands. I can’t wait to see how this metric evolves.
Fellow analyzers, make CV your new BFF. Explore its nuances, test beliefs, and harness insights to propel your organization forward.
It’s through deeply understanding – and judiciously applying – analytical allies that we lift our craft. Real impact stems from leveraging each tool’s strengths to optimize quality sustainably.
SixSigma.us offers both Live Virtual classes as well as Online Self-Paced training. Most option includes access to the same great Master Black Belt instructors that teach our World Class in-person sessions. Sign-up today!
Virtual Classroom Training Programs Self-Paced Online Training Programs


