Understanding The Central Limit Theorem In Quality Control
The central limit theorem stands as a fundamental principle in statistical quality control, transforming how manufacturers monitor and improve their production processes.
This statistical concept explains why quality control teams can make reliable decisions about entire production batches by testing only small samples.
Statistical Foundation For Six Sigma
The central limit theorem provides the mathematical basis for Six Sigma methodologies in quality management. By understanding how sample means distribute normally, quality teams can:
- Calculate process capability indices
- Establish statistical control limits
- Determine optimal sample sizes
- Validate process improvements
Key Highlights
- Statistical Rules For Quality Control
- Sample Size Impact On Measurements
- Process Control Using CLT
- Real Manufacturing Applications
- Six Sigma Implementation Methods
Statistical Foundation Of The Central Limit Theorem
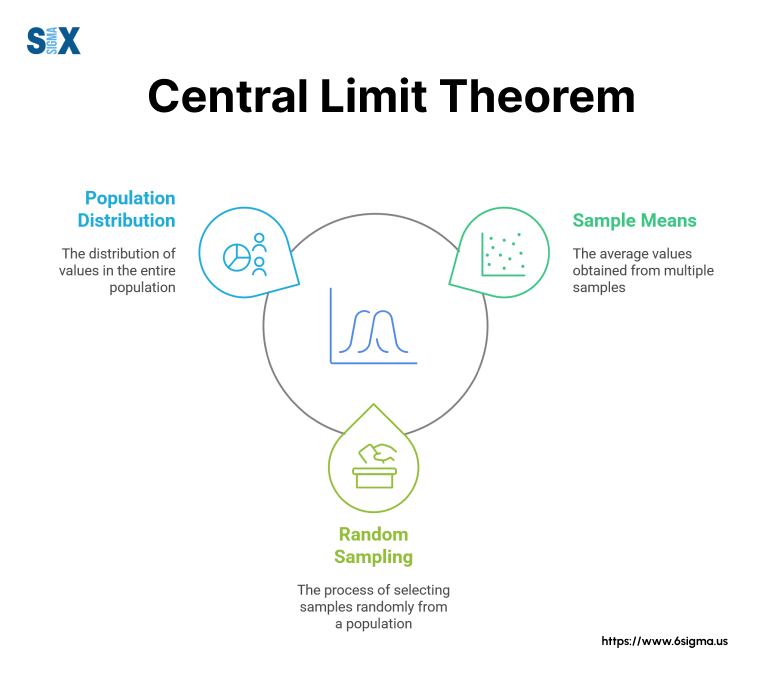
The central limit theorem states that when independent random samples are taken from any distribution, the sample means follow a normal distribution pattern.
This principle forms the backbone of statistical process control in manufacturing environments.
Core Definition of Central Limit Theorem In Quality Management
Manufacturing processes generate data that often appears random and unpredictable.
The central limit theorem defined shows that despite this apparent randomness, sample averages tend to form a bell-shaped curve.
Quality control teams use this knowledge to establish control limits and detect process variations.

Mathematical Basis For Process Control
When quality control teams measure product characteristics like weight or dimensions, the central limit theorem definition reveals three key properties:
- Sample means cluster around the true population mean
- Data spreads symmetrically above and below average
- Extreme values occur less frequently than values near the mean
These properties enable manufacturers to predict defect rates and set realistic specification limits.
For example, in pharmaceutical manufacturing, tablet weight variations follow this theorem, allowing precise quality control with limited sampling.
Practical Implementation of Central Limit Theorem In Manufacturing
To define central limit theorem in practice, consider a production line making metal components.
Each part’s dimensions vary slightly due to tool wear, material properties, and environmental conditions. By taking regular samples and plotting their means, quality engineers can:
- Monitor process stability
- Detect gradual shifts in production
- Validate measurement systems
- Adjust control parameters proactively
Statistical Parameters In Quality Control
The theorem works with samples of 30 or more measurements, though smaller samples can suffice when variation is minimal.
Quality teams typically monitor:
- Process mean (target value)
- Standard deviation (spread of measurements)
- Control limits (acceptable range)
- Sample size requirements
This statistical foundation helps manufacturers maintain consistent quality while minimizing inspection costs.
By understanding how the central limit theorem applies to their processes, quality teams can make informed decisions about sampling frequency and control limits.
Master the Statistical Foundations of Six Sigma
With our Six Sigma Champion Leadership Program join leaders who saved millions through Six Sigma methodologies.

Three Essential Rules Of The Central Limit Theorem
Manufacturing quality control relies on specific conditions of central limit theorem to ensure reliable statistical analysis.
These rules determine when and how to apply statistical methods in production environments.

Rule 1: Independence In Sampling
The first CLT condition requires independent sampling from the production process. In manufacturing, this means:
Each measurement must not influence subsequent measurements. For example, when checking electronic component resistance values, each sample should come from different production batches to maintain independence.
Quality teams must avoid sequential sampling from the same production run, as this might mask systematic process variations.
Random sampling across different shifts, machines, and operators provides more reliable data for statistical analysis.
Rule 2: Sample Size Requirements
The second fundamental rule addresses sample size adequacy. The conditions of central limit theorem specify that larger samples provide more reliable results.
In quality control:
Samples should typically include 30 or more measurements for optimal results. However, highly controlled processes might achieve reliable results with smaller samples.
For instance, precision machining operations might need only 15-20 measurements when variation is historically low.
Rule 3: Population Variance Limitations
The third CLT condition focuses on population variance constraints. Manufacturing processes must demonstrate:
- Finite variance in measurements
- Stable process conditions
- Controlled environmental factors
- Consistent raw material quality
These variance limitations help quality teams establish realistic control limits and detect process shifts effectively.
Practical Application In Production
When implementing these rules in manufacturing, quality teams should:
- Monitor process stability through control charts
- Validate measurement system accuracy
- Adjust sample sizes based on process capability
- Document sampling procedures and frequencies
The CLT conditions guide manufacturers in designing effective quality control programs.
For example, automotive parts manufacturers use these rules to determine optimal inspection frequencies and sample sizes for critical safety components.
Impact of Central Limit Theorem On Quality Decisions
Understanding these fundamental rules enables quality teams to:
- Set appropriate control limits
- Determine inspection frequencies
- Validate process improvements
- Make data-driven decisions
Manufacturing processes that follow these rules generate reliable statistical data, leading to better quality control decisions and reduced inspection costs.
Transform your quality control processes with our Lean Six Sigma Overview course.
Six Sigma Applications Of The Central Limit Theorem
The central limit theorem explained forms the statistical foundation of Six Sigma methodology in quality control.
This principle enables organizations to measure, analyze, and improve their manufacturing processes with precision.
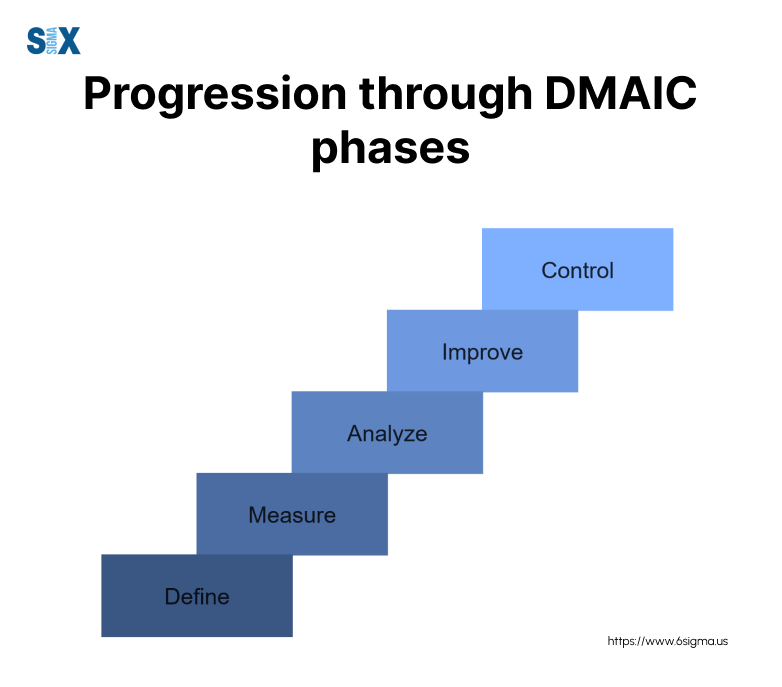
DMAIC Process Integration
During the Define phase, quality teams determine when to use central limit theorem for baseline measurements.
These measurements help establish current process capability and set improvement targets. For example, semiconductor manufacturers use this approach to analyze chip defect rates and set realistic yield targets.
Measurement System Analysis
The central limit theorem guides measurement system validation in Six Sigma projects. Quality teams use this principle to:
- Verify gauge repeatability
- Assess measurement accuracy
- Determine appropriate sample sizes
- Establish measurement frequencies
Analysis Phase Applications of the Central Limit Theorem
Six Sigma practitioners apply the central limit theorem during process analysis to:
- Identify root causes of variations
- Calculate process capability indices
- Determine statistical significance of improvements
- Validate correlation between variables
Manufacturing teams use these analyses to make data-driven decisions about process improvements. For instance, automotive manufacturers analyze torque measurements to optimize assembly operations.
Process Capability Studies
When to use central limit theorem becomes crucial during capability studies. These studies help manufacturers:
- Calculate Cp and Cpk values
- Set realistic specification limits
- Predict defect rates
- Monitor process stability
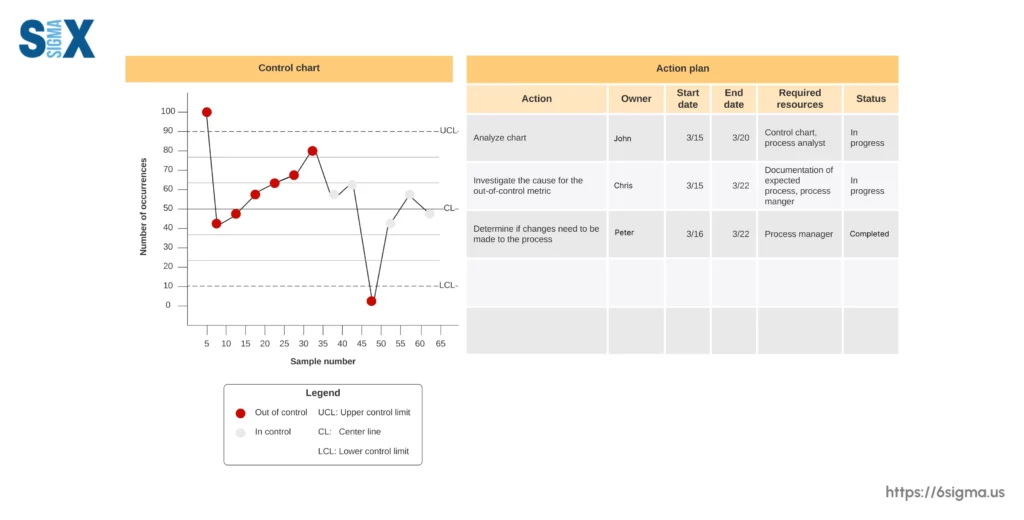
Control Phase Implementation
The theorem supports ongoing process control through:
- Statistical process control charts
- Real-time monitoring systems
- Automated inspection protocols
- Regular capability assessments
Quality teams use these tools to maintain improvements and detect process shifts early. For example, food manufacturers monitor fill weights to ensure consistent product quality while minimizing overfill costs.
Continuous Improvement Applications of the Central Limit Theorem
Six Sigma teams regularly apply the central limit theorem to:
- Validate process improvements
- Compare before/after performance
- Calculate financial benefits
- Justify additional improvements
These applications help organizations maintain their competitive edge through sustained quality improvement and cost reduction.
Mathematical Principles Of The Central Limit Theorem
The central limit theorem formula provides the mathematical basis for statistical process control in manufacturing.
Basic Formula Structure
The mathematical expression of the central limit theorem follows:
Z = (X̄ – μ)/(σ/√n)
Where:
- X̄ represents sample mean
- μ represents population mean
- σ represents standard deviation
- n represents sample size
Practical Application In Manufacturing
Manufacturing teams apply this formula to real production data. Consider a machining process producing metal components:
- Population mean (μ) = Target dimension
- Standard deviation (σ) = Process variation
- Sample size (n) = Number of measurements
- Z-score = Distance from target in standard deviations
Statistical Significance of Central Limit Theorem In Quality Control
The proof of central limit theorem demonstrates why sample means follow a normal distribution. This proof relies on three key mathematical concepts:
- Moment-generating functions
- Independence of random variables
- Properties of normal distribution
These concepts explain why quality control charts work effectively for process monitoring.
Calculation Methods For Process Control
Quality engineers use simplified versions of the central limit theorem formula for daily operations:
- Calculate sample means (X̄)
- Determine process standard deviation (σ)
- Set control limits (±3σ)
- Monitor Z-scores for process shifts
For example, pharmaceutical manufacturers use these calculations to monitor tablet weight variations and adjust processes accordingly.
Statistical Process Control Implementation
The mathematical foundation supports various quality control tools:
- Control charts with calculated limits
- Process capability indices
- Sampling plans
- Measurement system analysis
These tools help manufacturers maintain consistent product quality while optimizing inspection resources.
Practical Verification Methods of Central Limit Theorem
Quality teams verify the central limit theorem formula through:
- Historical data analysis
- Process capability studies
- Measurement system validation
- Control chart performance
This verification ensures reliable quality control decisions based on statistical evidence rather than assumptions.
Real-World Manufacturing Applications
Examples of central limit theorem in manufacturing demonstrate its practical value in quality control. These applications range from basic process monitoring to advanced quality improvement initiatives.
Pharmaceutical Manufacturing Case Study
Tablet weight control serves as a prime example of the limit central theorem in action. A pharmaceutical manufacturer monitors tablet weights across multiple production runs:
- Initial Data: Weights vary between 195-205mg
- Sample Size: 40 tablets per hour
- Control Limits: ±3 standard deviations
- Result: 99.7% of sample means fall within limits
This application enables consistent drug dosage while minimizing waste from out-of-specification products.
Automotive Parts Production with Central Limit Theorem
Brake disc manufacturing demonstrates another practical application:
- Production Rate: 1000 units daily
- Measurement: Diameter tolerance
- Sample Frequency: Every 50 pieces
- Statistical Control: Based on sample means
The central limit theorem helps predict overall product quality from limited sampling, reducing inspection costs while maintaining safety standards.
Electronics Manufacturing Application
Circuit board assembly showcases how sample size affects quality control:
Small Samples (n=10):
- Higher variation in means
- Less reliable predictions
- Frequent false alarms
Large Samples (n=30):
- Stable mean calculations
- Reliable predictions
- Fewer false alarms
Food Processing Implementation with Central Limit Theorem
Package filling operations demonstrate practical limit central theorem applications:
- Fill weight monitoring
- Moisture content control
- Product density checks
- Temperature variation analysis
These measurements help maintain product consistency while meeting regulatory requirements.
Precision Machining Quality Control
Examples of central limit theorem in precision manufacturing include:
- Dimensional control of critical parts
- Surface finish monitoring
- Tool wear prediction
- Process capability studies
These applications ensure high-precision components meet strict engineering specifications.
Process Improvement Results with the Central Limit Theorem
Manufacturing teams document improvements through:
- Reduced variation in measurements
- Decreased defect rates
- Lower inspection costs
- Improved process capability indices
These results validate the theoretical principles through measurable quality improvements and cost reductions.
Start your Six Sigma journey with our practical overview course.
Frequently Asked Questions on Central Limit Theorem
A. The central limit theorem states that when independent random samples are taken from any distribution, their sample means follow a normal distribution pattern. In manufacturing, this principle enables quality control teams to make reliable decisions about entire production batches by testing small samples.
A. The three key properties are:
– Sample means cluster around the true population mean
– Data spreads symmetrically above and below average
– Extreme values occur less frequently than values near the mean
These properties enable manufacturers to predict defect rates and set realistic specification limits.
A. The central limit theorem applies when three conditions are met:
1. Samples are independent of each other
2. Sample size is typically 30 or more measurements
3. The population has finite variance with stable process conditions
Quality teams must verify these conditions before applying CLT in their processes.
he total impact of central limit theorem in quality control includes:
– Enables reliable sampling strategies
– Reduces inspection costs while maintaining quality
– Supports Six Sigma methodology implementation
– Provides mathematical foundation for process control
– Allows accurate prediction of process capabilities
SixSigma.us offers both Live Virtual classes as well as Online Self-Paced training. Most option includes access to the same great Master Black Belt instructors that teach our World Class in-person sessions. Sign-up today!
Virtual Classroom Training Programs Self-Paced Online Training Programs


