Box-Cox Transformation: Converting Non-Normal Data to Normal Distribution
Data rarely follows a perfect normal distribution in real-world statistical analysis. When your data shows skewness or unequal variance, the Box-Cox transformation emerges as a powerful statistical method to normalize it.
This mathematical technique, developed by statisticians George Box and David Cox in 1964, has become essential for data analysts, Six Sigma practitioners, and researchers.
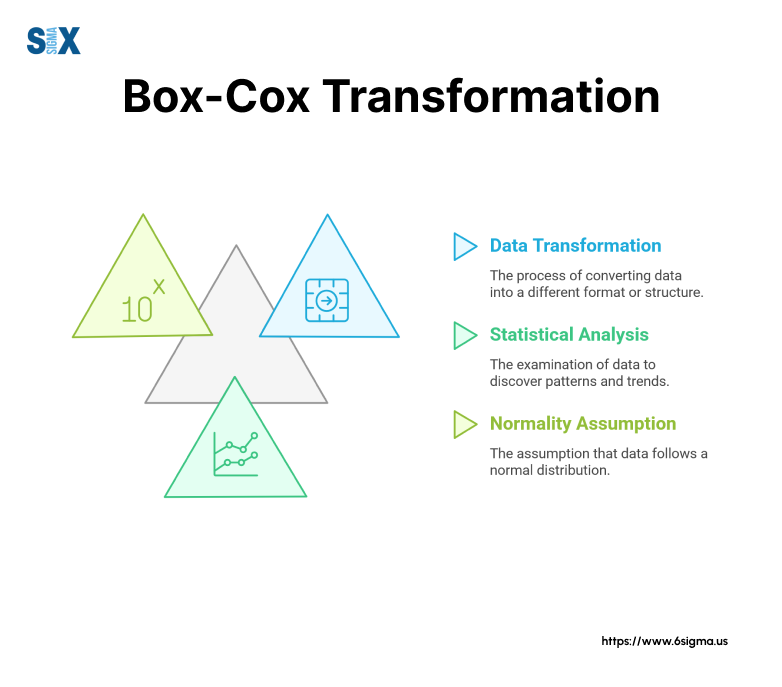
The Box-Cox transformation takes non-normal data and converts it into a shape that closely resembles a normal distribution.
This process makes the data suitable for statistical analyses that require normality assumptions, such as regression analysis, hypothesis testing, and process control charts.
Key Highlights
- Selecting optimal transformation parameters
- Implementing Box-Cox in statistical software
- Analyzing transformed data effectively
- Applying transformations in Six Sigma projects
What Is Box-Cox Transformation?
The Box-Cox transformation adjusts non-normal data into a normal distribution through a power transformation method.
This statistical technique modifies the shape of your data distribution while preserving the relationships between variables.
The basic Box-Cox transformation formula takes this form:
Y(λ) = (Y^λ – 1) / λ, when λ ≠ 0
Y(λ) = ln(Y), when λ = 0
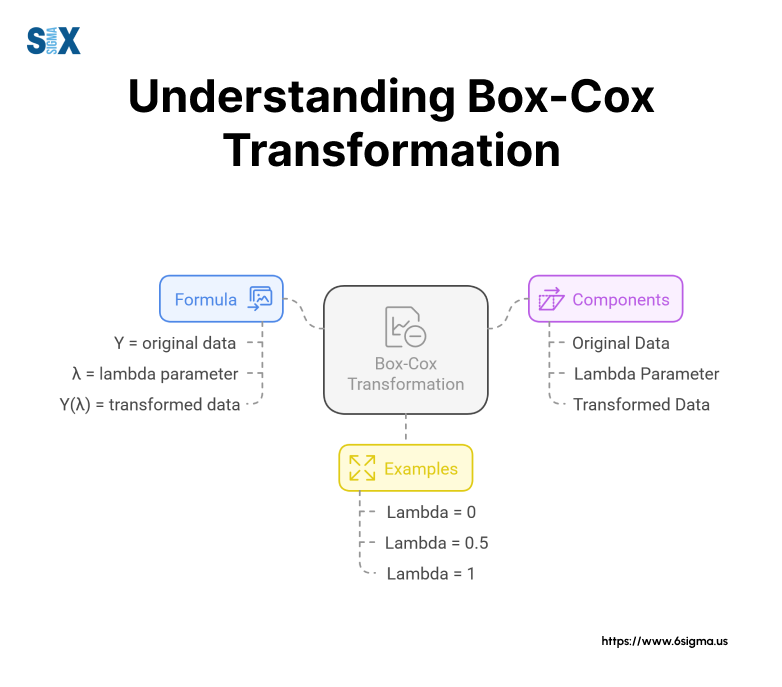
The lambda (λ) parameter determines how the data transforms. When lambda equals 1, the data remains unchanged except for a shift.
A lambda of 0.5 applies a square root transformation, while a lambda of 0 results in a natural log transformation. The method automatically selects the optimal lambda value that makes your data most normal.
For the transformation to work, your data must meet two key requirements. First, all values must be positive since you cannot take the log or root of negative numbers.
Second, the data should be continuous rather than discrete or categorical.
The Box-Cox transformation formula helps stabilize variance and reduce skewness in your dataset. When applied correctly, it creates data that better meets the assumptions needed for many statistical tests and analyses.
This makes it valuable for quality control charts, regression analysis, and process capability studies in Six Sigma projects.
Statistical software packages now handle the complex calculations involved in finding the optimal lambda value. This automation lets analysts focus on interpreting results rather than performing manual calculations.
When to Use Box-Cox Transformation
Statistical tests often require normally distributed data, yet real-world data frequently violates this assumption.
The Box-Cox transformation proves most valuable when your data shows clear signs of skewness or unequal variance.
Process capability studies in manufacturing often benefit from Box-Cox transformations.
When quality measurements show right-skewed distributions, such as cycle times or defect rates, transforming the data enables more accurate analysis and prediction.
Financial data analysis presents another key application. Market returns and price variations typically display non-normal patterns with heavy tails.
Applying the Box-Cox transformation helps normalize these distributions for more reliable statistical inference.
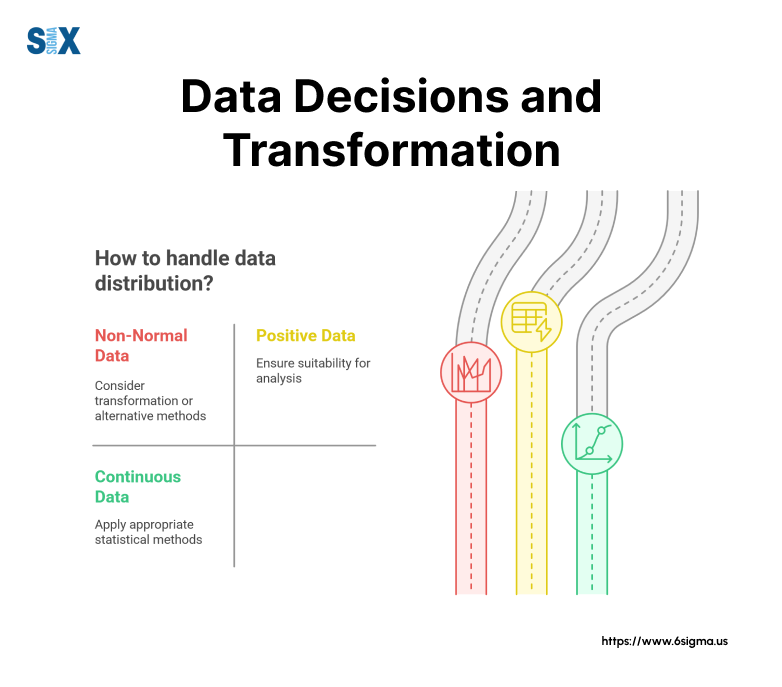
Before applying the transformation, verify these essential conditions:
Your data must contain only positive values, as the transformation cannot handle zero or negative numbers.
The measurements should be continuous rather than categorical or discrete. The relationship between variables should show signs of non-linearity or heteroscedasticity.
The transformation might not suit your needs if your data contains zeros or negative values.
In such cases, consider alternative methods like the Yeo-Johnson transformation or adding a constant to make all values positive before applying Box-Cox.
Monitor the transformed data’s practical interpretability. While the transformation improves statistical properties, it can make results harder to explain to non-technical stakeholders.
Always balance statistical correctness with practical usefulness in your analysis.
Box-Cox Transformation in Practice
Step-by-Step Implementation
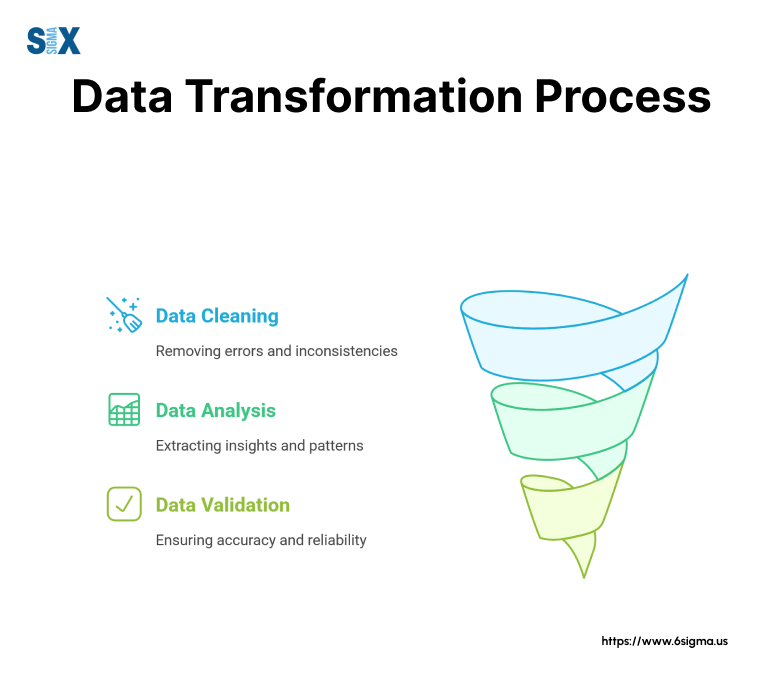
Implementing a Box-Cox transformation requires careful preparation and execution to ensure accurate results. The process begins with data assessment and ends with validation of the transformed data.
First, examine your dataset for any zeros or negative values. Remove or adjust these values since the Box-Cox transformation works only with positive numbers.
For datasets with zeros, adding a small constant (typically 0.5 or 1) to all values creates the necessary positive values while maintaining data relationships.
Next comes lambda selection, the critical parameter that determines your transformation’s effectiveness.
Statistical software calculates the optimal lambda value by testing different values between -5 and +5. The selected lambda minimizes the standard deviation of the transformed data.
Here’s a practical Box-Cox transformation example using quality control data from a manufacturing process.
Consider cycle time measurements showing right-skewed distribution. The raw data ranges from 2.5 to 15.6 minutes, with most values clustered around 4 minutes but occasional high values creating a long right tail.
Running the Box-Cox transformation might yield an optimal lambda of 0.2. Applying this value transforms the skewed cycle time data into a more normal distribution.
The transformed values now show better symmetry and more evenly distributed variation around the mean.
After transformation, validate your results through normality tests and visual inspection of probability plots. Check residual plots for any remaining patterns or outliers.
The transformed data should show improved normality while maintaining meaningful relationships between variables.
Remember to document your transformation parameters and process.
When presenting results, clearly state that the analysis used transformed data and explain how to interpret the findings in terms of the original measurements.
Software Implementation
Modern statistical software packages simplify the Box-Cox transformation process through built-in functions and intuitive interfaces. Each platform offers unique advantages for different analytical needs.
Minitab provides a straightforward approach to Box-Cox transformation through its quality tools menu.
Navigate to Stat > Control Charts > Box-Cox Transformation. Select your data column and click OK.
Minitab automatically calculates the optimal lambda value and displays the transformed data alongside diagnostic plots. The software also offers roundable lambda values for easier reporting and interpretation.
SPSS users can perform Box-Cox transformations using syntax commands or the graphical interface.
Access the feature through Analyze > Transform > Compute Variable. The SPSS Box-Cox transformation syntax requires specific command structure:
COMPUTE transformed_variable = T(original_variable). Execute this command to generate your transformed dataset and accompanying normality tests.
R programming offers flexible implementation through several packages. The ‘MASS‘ package includes the boxcox() function, while ‘forecast’ provides automatic Box-Cox transformation for time series data.
Python users can utilize scipy.stats.boxcox() for similar functionality, making it accessible for data science workflows.
For Six Sigma practitioners, Minitab’s Box-Cox transformation features integrate seamlessly with process capability analysis and control charts.
The software generates transformed control limits and capability indices automatically, streamlining the analysis process.
Each platform generates diagnostic plots to verify transformation effectiveness. These include normal probability plots, histograms of transformed data, and lambda optimization curves.
Review these outputs to ensure your transformation achieved the desired normality improvement.
Export options vary by platform. Minitab and SPSS allow direct worksheet storage of transformed values, while R and Python require explicit commands to save results.
Document your transformation parameters regardless of the software used to ensure reproducibility.
Unlock the power of statistical analysis with Minitab Essential with for Precise Data Transformation.
Box-Cox Transformation in Six Sigma
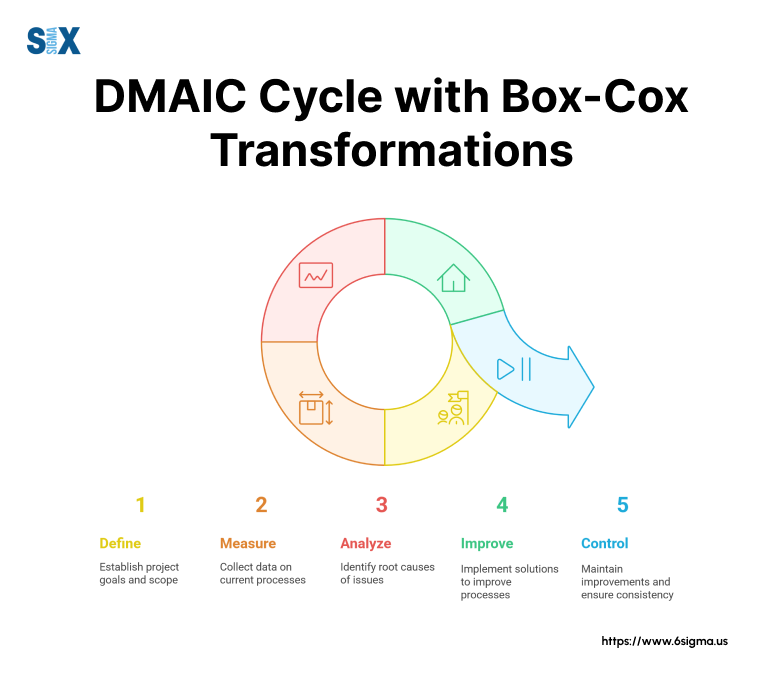
The Box-Cox transformation plays a crucial role in Six Sigma methodology, particularly during the Measure and Analyze phases of DMAIC.
Quality improvement teams rely on this transformation when process data shows non-normal patterns, ensuring accurate capability analysis and process control.
During the Measure phase, teams often encounter non-normal data in process measurements. Manufacturing cycle times, defect counts, and material properties frequently display right-skewed distributions.
The Box-Cox transformation normalizes this data, enabling reliable baseline measurements and process capability calculations.
The Analyze phase benefits from transformed data when investigating process variations and identifying root causes.
Normal data allows teams to apply standard statistical tests with confidence. Control charts based on transformed data provide more reliable signals of process shifts and special cause variations.
Process capability analysis becomes more meaningful after applying the Box-Cox transformation.
Cp and Cpk calculations assume normal distribution, and working with transformed data yields more accurate capability indices.
This helps teams set realistic improvement targets and evaluate process performance fairly.
Quality improvement applications extend beyond basic process control. Design of Experiments (DOE) often requires normal data for valid analysis.
The Box-Cox transformation helps ensure experimental results meet statistical assumptions, leading to more reliable conclusions about factor effects and optimal settings.
Teams should document transformation parameters in control plans and standard operating procedures. This ensures consistent application across different analysis periods and enables proper interpretation of historical data.
When implementing process improvements, teams must consider how transformations affect specification limits and control chart calculations.
Discover how statistical methods like Box-Cox can revolutionize your projects with Six Sigma Champion Leadership Program
Practical Tips
Success with Box-Cox transformations relies on proper implementation and interpretation. Several key practices ensure reliable results while avoiding common pitfalls in data analysis.
Always verify data requirements before applying the transformation. Missing values, zeros, or negative numbers can derail the analysis.
Address these issues through appropriate data cleaning or alternative transformation methods. Document any data modifications to maintain analysis transparency.
Watch for over-transformation of your data. Multiple transformations can obscure real patterns and relationships.
Stick to single transformations unless strong statistical evidence supports additional steps. Monitor the practical significance of your results alongside statistical significance.
When troubleshooting transformation issues, start by examining your raw data distribution.
Unusual patterns or outliers might indicate underlying process issues that require attention before transformation. Check lambda values against similar historical analyses to ensure consistency.
Conclusion
The Box-Cox transformation remains a vital tool for handling non-normal data in statistical analysis. Its integration with modern software makes implementation easier while maintaining statistical rigor.
As data analysis evolves, the method continues adapting to new applications in machine learning and automated analysis systems.
Future applications will likely focus on real-time transformations in automated systems and integration with artificial intelligence algorithms.
The growing emphasis on practical interpretability alongside statistical accuracy shapes how analysts apply these transformations.
Remember that successful transformation requires both technical understanding and practical judgment.
Balance statistical requirements with business needs when applying Box-Cox transformations to your data analysis projects.
SixSigma.us offers both Live Virtual classes as well as Online Self-Paced training. Most option includes access to the same great Master Black Belt instructors that teach our World Class in-person sessions. Sign-up today!
Virtual Classroom Training Programs Self-Paced Online Training Programs


