Bowtie Model: Revolutionizing Risk Management
While approaching risk management organizations use multiple tools and techniques, but the Bowtie model stands out as a powerful visual tool.
It powers identifying, visualizing, and mitigating potential risks in an easy-to-understand manner.
Key Highlights
- Decoding the bowtie
- Its functions and importance
- Creating the bowtie diagram
- Implementing complex bowtie model(s)
What is the Bowtie Model?
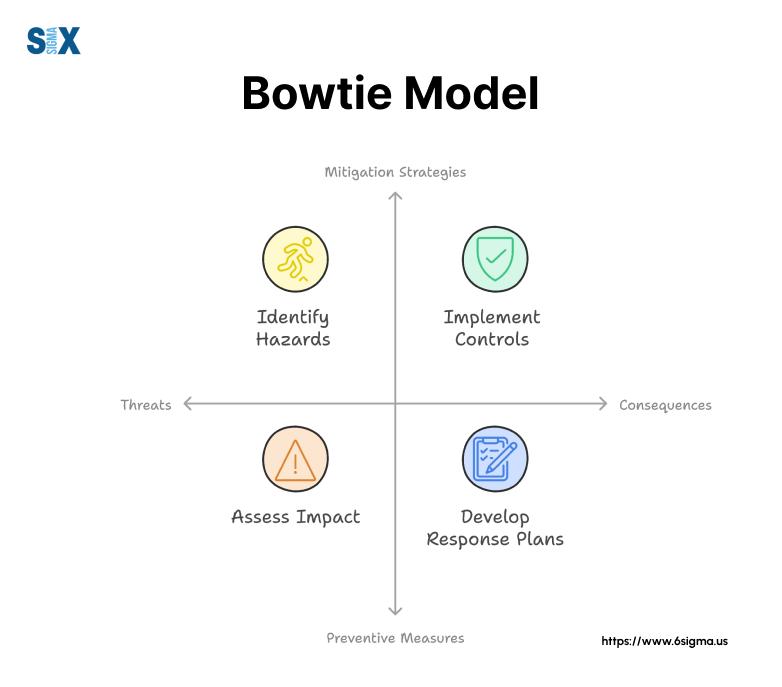
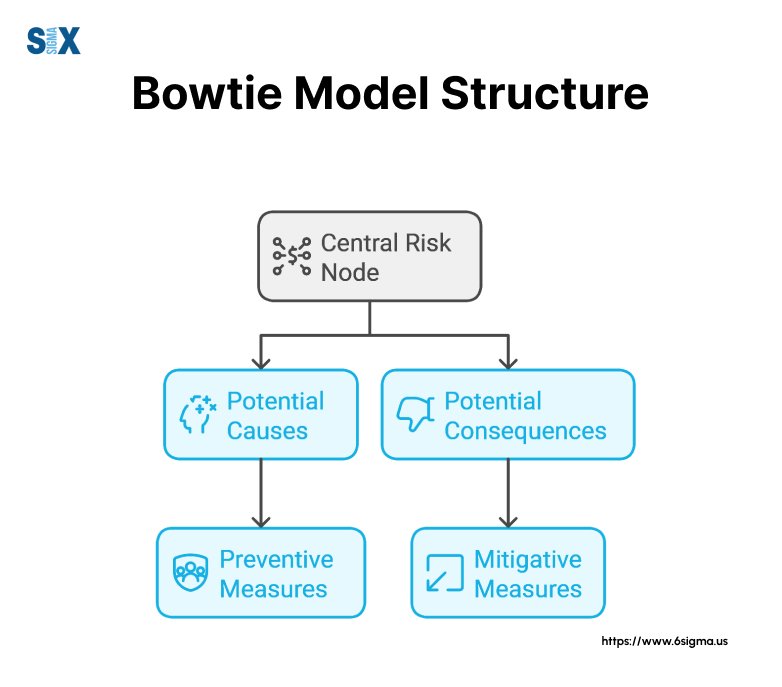
The bowtie model, aka bowtie method or bowtie analysis, helps visually represent risk illustrating the relationship between potential causes of an undesired event, the event itself, and its possible consequences.
The model gets its name from its distinctive shape, which resembles a bowtie when fully constructed.
The key components of a bowtie model include:
- Hazard: The central element that has the potential to cause harm.
- Top Event: The point at which control over the hazard is lost.
- Threats: Potential causes that could lead to the top event.
- Consequences: Potential outcomes if the top event occurs.
- Barriers: Preventive and mitigative measures to control risks.
Historical Context and Evolution
The bowtie method of risk assessment has its roots in the 1970s when it was first conceptualized by the Imperial Chemical Industries in the UK.
However, it gained significant traction in the 1990s when Royal Dutch Shell adopted and refined the method for use in its operations.
Over the years, the bowtie model risk management approach has evolved from a simple diagram to a sophisticated risk analysis tool.
With the advent of bowtie model SaaS platforms, organizations can now create, analyze, and manage complex risk scenarios more efficiently than ever before.
Why It’s Called a “Bowtie”
The name “bowtie” comes from the shape of the diagram when fully constructed.
The left side of the bowtie represents the potential causes or threats, while the right side shows the potential consequences.
The knot in the middle represents the top event – the point at which control is lost. This visual representation makes it easy for stakeholders to understand and communicate complex risk scenarios.
The importance of the bowtie method lies in its ability to provide a clear, comprehensive view of risk scenarios.
By visually mapping out threats, consequences, and barriers, the bowtie model helps organizations identify potential weaknesses in their risk management strategies and implement more effective controls.
For example, in a workplace safety scenario, a simple bowtie model example might look like this:
- Hazard: Working at heights
- Top Event: Fall from height
- Threats: Slippery surfaces, inadequate training, faulty equipment
- Consequences: Injury, fatality, property damage, legal liabilities
- Barriers: Safety harnesses, proper training, equipment maintenance
By using the bowtie method risk management approach, organizations can proactively identify and address potential risks before they escalate into major incidents.
This makes the bowtie model an invaluable tool for risk assessment across various industries, from oil and gas to aviation and healthcare.
Enhance your risk management approach with our Yellow Belt training
The Anatomy of a Bowtie Diagram
Understanding the structure of a bowtie diagram is crucial for effectively implementing the bowtie method of risk assessment.
Take a look at how these elements work together to create a powerful risk management tool.
Hazard and Top Event
At the center of every bowtie diagram is the hazard and the top event.
- Hazard: This is the potential source of harm or damage. In a bowtie model example, a hazard could be “flammable materials in a chemical plant.”
- Top Event: This represents the point at which control over the hazard is lost. Continuing our example, the top event might be “uncontrolled release of flammable material.”
The hazard and top event form the core of the bowtie model risk assessment, serving as the focal point from which all other elements branch out.
Threats and Preventive Barriers
On the left side of the bowtie diagram, we find threats and preventive barriers:
- Threats: These are the potential causes that could lead to the top event. For our chemical plant scenario, threats might include “equipment failure,” “human error,” or “natural disasters.”
- Preventive Barriers: These are the controls put in place to prevent threats from causing the top event. Examples include “regular equipment maintenance,” “staff training programs,” and “robust emergency response plans.”
The bowtie method risk management approach emphasizes the importance of identifying all potential threats and implementing effective preventive barriers to minimize risk.
Consequences and Mitigative Barriers
On the right side of the bowtie diagram, we see consequences and mitigative barriers:
- Consequences: These are the potential outcomes if the top event occurs. In our example, consequences could include “fire,” “explosion,” or “environmental contamination.”
- Mitigative Barriers: These are measures designed to reduce the severity of consequences if the top event does occur. Examples might include “fire suppression systems,” “evacuation procedures,” or “containment measures.”
By visualizing both preventive and mitigative barriers, the bowtie model provides a comprehensive view of an organization’s risk management strategy.
Escalation Factors and Controls
Lastly, the bowtie diagram includes escalation factors and their associated controls:
- Escalation Factors: These are conditions that could cause a barrier to fail or be ineffective. For instance, “lack of maintenance” could be an escalation factor for the “regular equipment maintenance” barrier.
- Controls: These are measures put in place to manage escalation factors. Continuing our example, a control might be “implementing a rigorous maintenance schedule and audit process.”
The inclusion of escalation factors and controls in the bowtie model risk management approach ensures a more robust and realistic assessment of potential risks and the effectiveness of barriers.
Understanding the anatomy of a bowtie diagram is crucial for leveraging the full power of the bowtie method.
These SaaS bowtie model platforms often provide additional features like real-time updates, collaboration tools, and advanced analytics to enhance the risk assessment process.
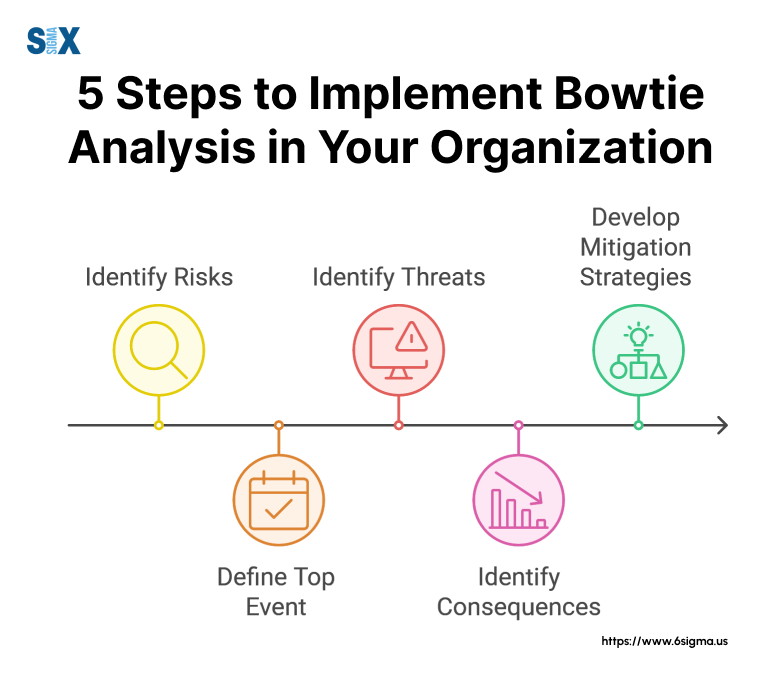
Step-by-Step Guide to Creating a Bowtie Diagram
Mastering the bowtie method of risk assessment is crucial for effective risk management.
This step-by-step guide will walk you through the process of creating a bowtie diagram, helping you implement the bowtie model risk management approach in your organization.
Identifying the Hazard and Top Event
The first step in the bowtie method is identifying the hazard and top event:
- Define the hazard: Identify a potential source of harm or damage in your operation.
- Determine the top event: Pinpoint the moment when control over the hazard is lost.
Example: In a chemical plant, the hazard might be “toxic chemicals,” and the top event could be “uncontrolled release of toxic chemicals.”
Brainstorming Threats and Consequences
Next, identify potential threats and consequences:
- List threats: Brainstorm all possible causes that could lead to the top event.
- Identify consequences: Consider all potential outcomes if the top event occurs.
Use a diverse team to ensure a comprehensive analysis.
This step is crucial in the bowtie model risk assessment process as it helps identify all potential risk scenarios.
Determining Preventive and Mitigative Barriers
Now, focus on barriers:
- Preventive barriers: Identify measures to prevent threats from causing the top event.
- Mitigative barriers: Determine actions to reduce the severity of consequences.
Ensure each barrier is specific, measurable, and realistic.
This step highlights the importance of the bowtie method in developing a robust risk management strategy.
Considering Escalation Factors
Identify potential weaknesses in your barriers:
- List escalation factors: Determine conditions that could cause barriers to fail.
- Develop controls: Create measures to manage these escalation factors.
This step enhances the effectiveness of your bowtie model risk management approach by addressing potential vulnerabilities.
Finalizing and Reviewing the Diagram
Complete your bowtie diagram:
- Arrange elements: Place all components in the appropriate sections of the diagram.
- Review and refine: Critically assess the diagram for completeness and accuracy.
- Seek feedback: Have stakeholders review the diagram for additional insights.
Creating a bowtie diagram is an iterative process.
Regular reviews and updates are essential to maintain its effectiveness as a risk assessment tool.
By following these steps, you can create a comprehensive bowtie diagram that visualizes your risk and management strategies.
Many organizations are now leveraging bowtie model SaaS solutions to streamline this process, allowing for easier creation, collaboration, and updating of bowtie diagrams.
The bowtie method of risk assessment provides a clear, visual representation of risk scenarios, making it an invaluable tool for risk management professionals, safety engineers, and business leaders.
The power of the bowtie method lies not just in creating the diagram, but in using it as a dynamic tool for ongoing risk management and communication.
Regular reviews and updates of your bowtie diagrams will ensure they remain relevant and effective.
Applications of the Bowtie Model Across Industries
The bowtie model has proven to be a versatile and effective tool for risk management across various industries.
Let’s see how different sectors leverage the bowtie method of risk assessment to enhance their safety and operational efficiency.
Oil and Gas
In the high-risk oil and gas industry, the bowtie model risk management approach has become a standard practice.
Companies use it to:
- Identify potential hazards in drilling operations
- Assess risks associated with offshore platforms
- Manage pipeline integrity
Aviation
The aviation industry relies heavily on the bowtie method to:
- Analyze potential flight risks
- Manage airport safety procedures
- Assess maintenance-related risks
Example: Airlines use bowtie diagrams to visualize and manage risks associated with in-flight emergencies, helping to improve overall flight safety.
Healthcare
In healthcare, the bowtie model is increasingly used to:
- Manage patient safety risks
- Assess potential medication errors
- Analyze infection control measures
Finance and Banking
Financial institutions utilize the bowtie method to:
- Assess cybersecurity risks
- Manage regulatory compliance
- Analyze potential fraud scenarios
Information Technology
In IT, the bowtie model helps organizations:
- Manage data security risks
- Assess potential system failures
- Plan for disaster recovery
The versatility of the bowtie model risk management approach across these diverse industries demonstrates its effectiveness as a risk assessment tool.
Benefits and Limitations of Bowtie Analysis
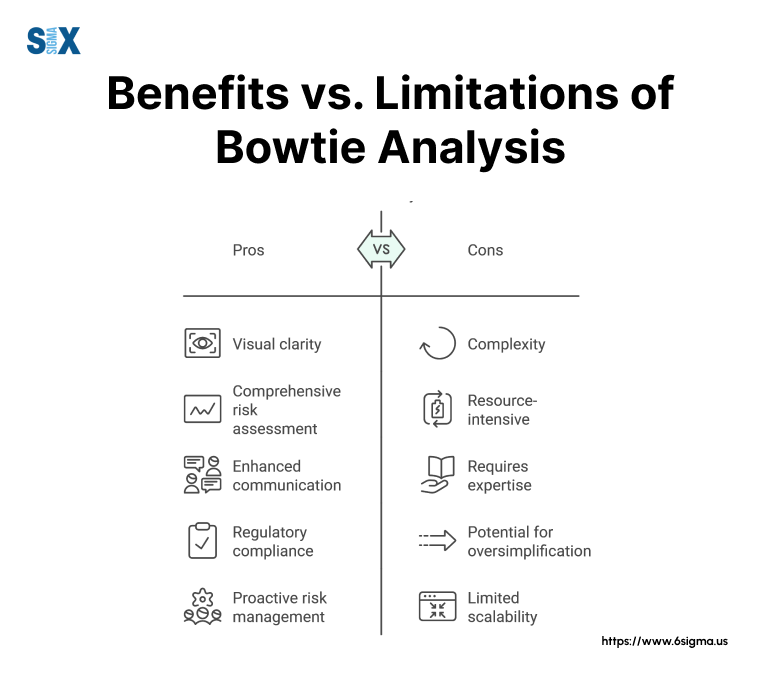
Understanding the advantages and potential drawbacks of the bowtie method is crucial for effective implementation.
Advantages of Using the Bowtie Model
- Visual Clarity: The bowtie diagram provides a clear, easy-to-understand visual representation of risk scenarios.
- Comprehensive Overview: It offers a holistic view of threats, consequences, and barriers in one diagram.
- Proactive Approach: Helps identify potential risks before they occur, enabling preventive measures.
- Communication Tool: Facilitates effective risk communication across different levels of an organization.
- Continuous Improvement: Supports ongoing risk management and barrier effectiveness assessment.
Potential Drawbacks and How to Overcome Them
- Time-Consuming: Creating comprehensive bowtie diagrams can be time-intensive.
Solution: Use bowtie model SaaS solutions to streamline the process. - Oversimplification: Complex risks might be oversimplified in a bowtie diagram.
Solution: Use multiple diagrams or incorporate additional details where necessary. - Static Nature: Traditional bowtie diagrams can become outdated quickly.
Solution: Implement regular reviews and updates, or use dynamic SaaS bowtie model tools.
Understanding these pros and cons helps organizations maximize the benefits of the bowtie method while mitigating its limitations.
Bowtie Model vs. Other Risk Assessment Methods
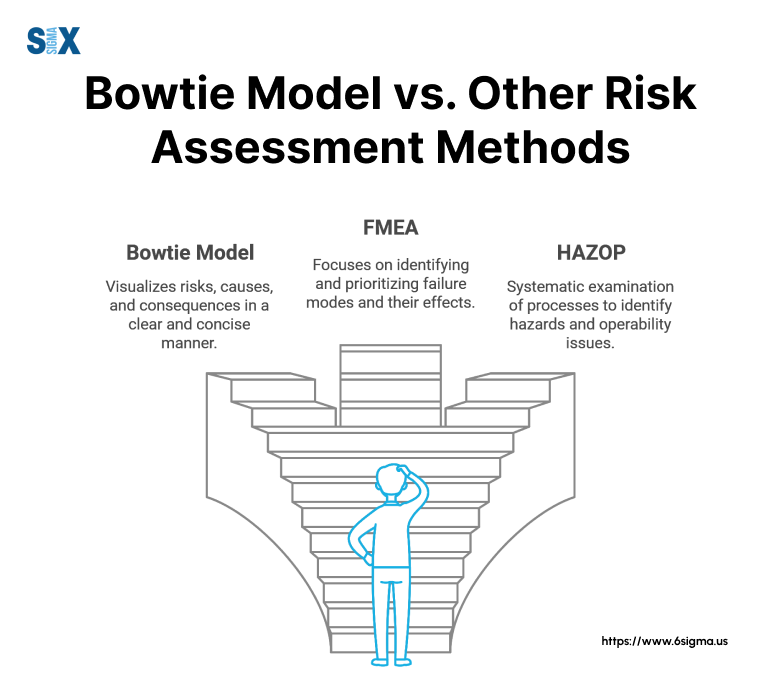
To fully appreciate the bowtie model, it’s essential to compare it with other risk assessment methods.
Fault Tree Analysis
Fault Tree Analysis (FTA) focuses on identifying all possible causes of a specific undesired event.
Comparison: While FTA is more detailed in analyzing causes, the bowtie method provides a more balanced view of both causes and consequences.
Event Tree Analysis
Event Tree Analysis (ETA) examines the possible outcomes of an initiating event.
Comparison: The bowtie method combines elements of both FTA and ETA, providing a more comprehensive risk picture.
FMEA (Failure Mode and Effects Analysis)
FMEA is a step-by-step approach for identifying all possible failures in a design, process, or product.
Comparison: While FMEA is more detailed, the bowtie method offers a more visual and intuitive representation of risk scenarios.
The risk bowtie method stands out for its ability to provide a balanced, visual representation of both causes and consequences of risk events.
Best Practices for Implementing Bowtie Analysis
To maximize the effectiveness of the bowtie method risk management approach, consider these best practices:
Establishing a Cross-Functional Team
Involve experts from various departments to ensure a comprehensive risk assessment.
Ensuring Data Quality and Accuracy
Use reliable data sources and validate information to create accurate bowtie diagrams.
Regular Review and Updates
Regularly review and update your bowtie diagrams to reflect changes in your risk landscape.
Integration with Existing Risk Management Systems
Integrate the bowtie method with your existing risk management processes for a holistic approach.
Bowtie Model in the Digital Age: Software and Tools
As risk management evolves, so do the tools available for bowtie analysis.
Overview of Popular Bowtie Analysis Software
Several bowtie model SaaS solutions are available, offering features like:
- Real-time collaboration
- Automated diagram creation
- Integration with risk databases
- Dynamic risk monitoring
Choosing the Right Tool for Your Organization
Consider factors like:
- Ease of use
- Integration capabilities
- Scalability
- Cost-effectiveness
By leveraging these SaaS bowtie model tools, organizations can streamline their risk assessment processes and enhance their overall risk management strategies.
Conclusion
The bowtie model has emerged as a powerful tool in the risk management, offering a visual, comprehensive approach to understanding and mitigating risks.
From oil and gas to healthcare, its applications span diverse industries, demonstrating its versatility and effectiveness.
By embracing the bowtie method of risk assessment, organizations can:
- Gain a clearer understanding of their risk landscape
- Implement more effective preventive and mitigative measures
- Improve communication about risks across all levels of the organization
- Continuously enhance their risk management strategies
As we’ve explored, the bowtie model, while not without its challenges, offers significant advantages over other risk assessment methods.
By following best practices and leveraging modern SaaS solutions, organizations can maximize the benefits of this powerful risk management tool.
Start implementing bowtie analysis in your organization.
Whether you’re a risk management professional, safety engineer, or business leader, the insights gained from this method can drive significant improvements in your risk management practices.
Effective risk management is an ongoing process. Regularly review and update your bowtie diagrams, stay informed about industry trends, and continue to refine your approach.
With the bowtie model as part of your risk management toolkit, you’ll be well-equipped to navigate the complex risks.
SixSigma.us offers both Live Virtual classes as well as Online Self-Paced training. Most option includes access to the same great Master Black Belt instructors that teach our World Class in-person sessions. Sign-up today!
Virtual Classroom Training Programs Self-Paced Online Training Programs


