Understanding Bimodal and Unimodal Distributions: Statistical Analysis Guide
Statistical distributions form the backbone of data analysis, helping professionals and researchers make informed decisions across various fields.
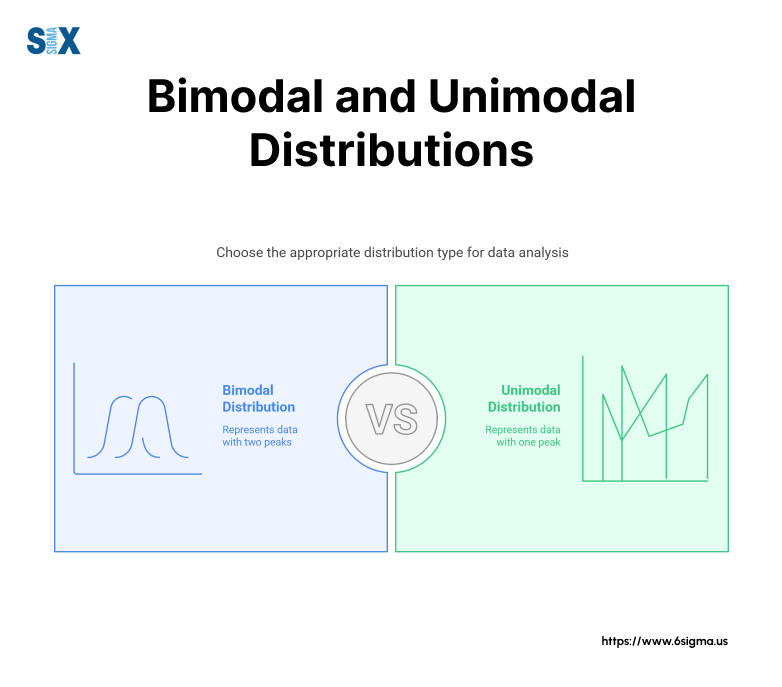
When examining data patterns, two fundamental distribution types emerge: unimodal and bimodal distributions.
These patterns reveal crucial insights about data behavior and guide analytical approaches in statistics, machine learning, and predictive modeling.
Key Highlights
- Learn distribution basics and core concepts
- Explore unimodal vs bimodal characteristics
- Discover real-world statistical applications
- Master distribution analysis techniques
Unimodal and Bimodal Distributions
Statistical distributions reveal patterns in data through their shapes and characteristics.
The term “modality” refers to the number of peaks present in a distribution curve, which directly impacts how analysts interpret and use the data.
What is Distribution Modality?
A unimodal distribution shows one distinct peak in its data pattern. This peak represents the most frequent value or central tendency in the dataset.
Common examples include test scores in a single class or height measurements in a specific age group.
Bimodal distributions display two separate peaks, indicating two distinct groups within the data. These peaks often signal different populations or underlying processes.
For instance, customer shopping patterns might peak during morning and evening hours, creating a bimodal pattern.
Basic Distribution Characteristics
Unimodal distributions typically feature:
- One clear central peak
- Gradual decline on both sides
- Symmetrical or skewed shape
- Single dominant value range
Bimodal distributions exhibit:
- Two distinct high points
- Valley between peaks
- Separate data clusters
- Multiple central tendencies
Statistical Significance In Data Analysis
The presence of one or two peaks guides statistical testing methods. Unimodal patterns often allow for standard statistical approaches, while bimodal patterns might require specialized analytical techniques.
For machine learning applications, recognizing these patterns helps in:
- Model selection
- Data preprocessing
- Feature engineering
- Outcome prediction
Distribution Shape Impact
Distribution shapes influence:
- Data interpretation methods
- Statistical test selection
- Analytical approach decisions
- Result reporting strategies
Understanding these fundamental concepts enables analysts to choose appropriate statistical methods and make accurate data-driven decisions.
This knowledge forms the foundation for advanced statistical analysis and practical applications across various fields.
Key Characteristics of Unimodal Distributions
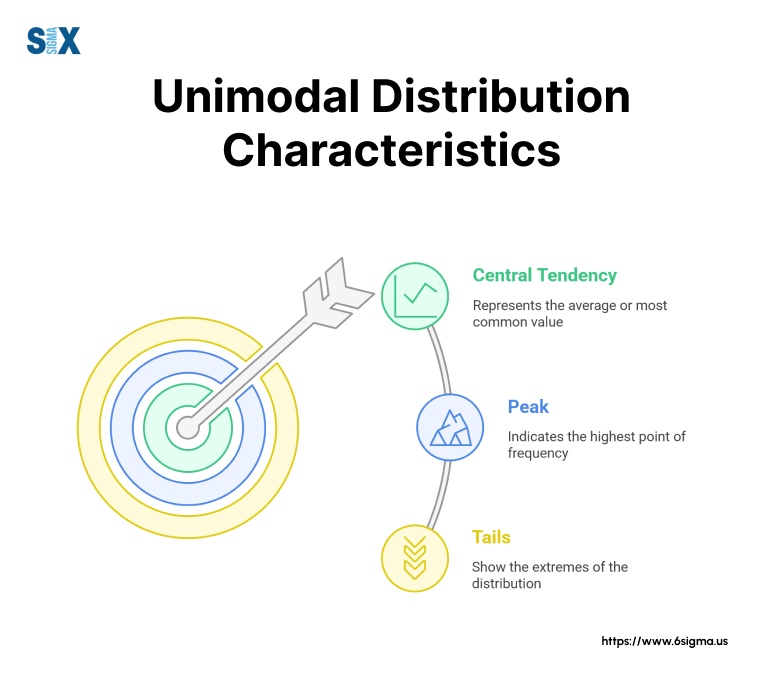
Unimodal distributions represent data patterns with a single peak, making them essential in statistical analysis and data interpretation.
These distributions appear frequently in natural phenomena, from height measurements to test scores.
Single Peak Properties
The defining feature of a unimodal distribution lies in its single peak, known as the mode. This peak represents the most frequent value in the dataset.
The data points cluster around this central value, with frequency decreasing on both sides.
Symmetry Patterns In Unimodal Data
Unimodal distributions fall into two main categories based on their symmetry:
Symmetrical Distributions:
- Equal spread on both sides
- Mean equals median equals mode
- Normal distribution serves as prime example
Asymmetrical Distributions:
- Uneven spread around the peak
- Mean, median, and mode differ
- Right or left skew possible
Mathematical Properties And Measures
Several key measurements define unimodal distributions:
Central Tendency:
The mean, median, and mode provide crucial information about data concentration. In perfectly symmetrical distributions, these three measures align at the same point.
Spread Indicators:
Standard deviation and variance measure data dispersion around the central peak. These values help determine the distribution’s shape and width.
Practical Applications
Unimodal distributions guide decision-making in:
- Quality Control: Monitoring manufacturing processes
- Market Research: Analyzing consumer preferences
- Academic Assessment: Evaluating student performance
- Scientific Research: Measuring experimental outcomes
The shape and characteristics of unimodal distributions inform statistical testing choices and data interpretation methods.
Understanding these properties helps analysts select appropriate analytical tools and make accurate predictions.
Distribution Analysis Tools
Modern statistical software offers various tools to analyze unimodal distributions:
- Histogram generation
- Normality testing
- Skewness calculation
- Distribution fitting
These tools help professionals identify distribution patterns and make data-driven decisions across various fields and applications.
Master Statistical Distribution Analysis with Our Green Belt Program
Transform your data analysis skills from basic to professional

Understanding Bimodal Distributions
Bimodal distributions showcase two distinct peaks in data patterns, indicating the presence of multiple subgroups or processes within a dataset.
These distributions play a crucial role in identifying mixed populations and complex data relationships.
Dual Peak Properties
The signature characteristic of bimodal distributions lies in their two peaks, each representing a local maximum in the data frequency.
These peaks often signal different underlying populations or processes within the same dataset.
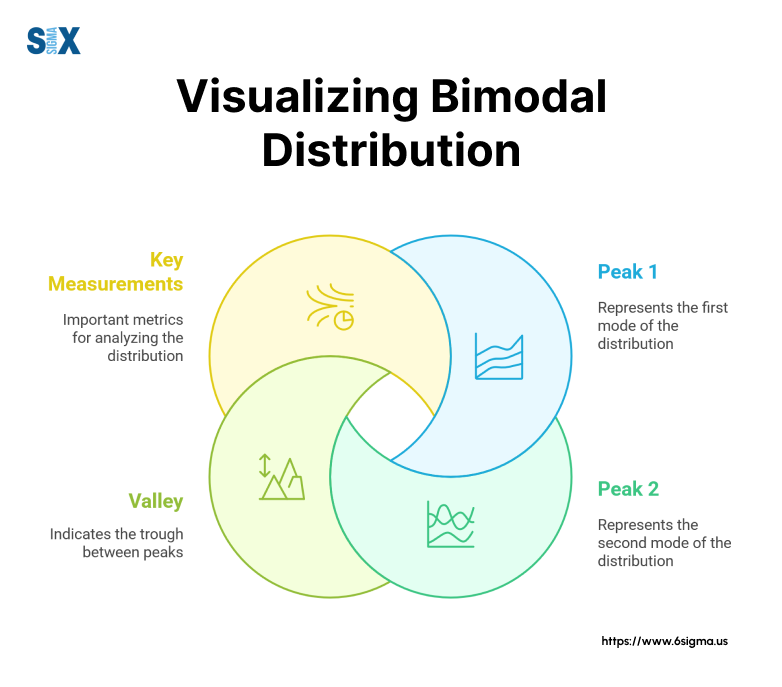
Valley Formation And Significance
Between the two peaks lies a valley, technically known as the local minimum. This valley’s depth and width provide valuable information about the separation between the two subgroups.
Deeper valleys suggest more distinct separation, while shallow valleys might indicate overlapping populations.
Statistical Measures In Bimodal Analysis
Several key measurements help quantify bimodal distributions:
Peak Characteristics:
- Height differences between peaks
- Distance between modal values
- Relative population sizes
Valley Analysis:
- Minimum point location
- Separation index
- Population overlap degree
Identifying True Bimodality
Not every distribution with two apparent peaks qualifies as truly bimodal. Statistical tests help determine genuine bimodality:
- Hartigan’s dip test
- Bimodality coefficient
- Mixture model analysis
- Distribution fitting tests
Real-World Applications
Bimodal distributions appear frequently in:
- Market Segmentation: Customer behavior analysis
- Biological Studies: Species differentiation
- Traffic Analysis: Peak hour patterns
- Quality Control: Process optimization
Impact On Statistical Analysis
The presence of bimodality affects:
- Choice of statistical tests
- Data interpretation methods
- Predictive modeling approaches
- Population sampling strategies
Understanding these characteristics helps analysts:
- Select appropriate analytical methods
- Make accurate interpretations
- Develop effective solutions
- Present findings clearly
Modern Analysis Tools
Current statistical software provides specialized tools for bimodal analysis:
- Distribution visualization
- Peak detection algorithms
- Separation analysis
- Population modeling
These tools enable professionals to extract meaningful insights from bimodal data patterns and make informed decisions based on their findings.
Unimodal vs Bimodal Distributions
Understanding the distinctions between unimodal and bimodal distributions helps analysts choose appropriate statistical methods and interpret data accurately.
These differences impact everything from research design to data analysis approaches.
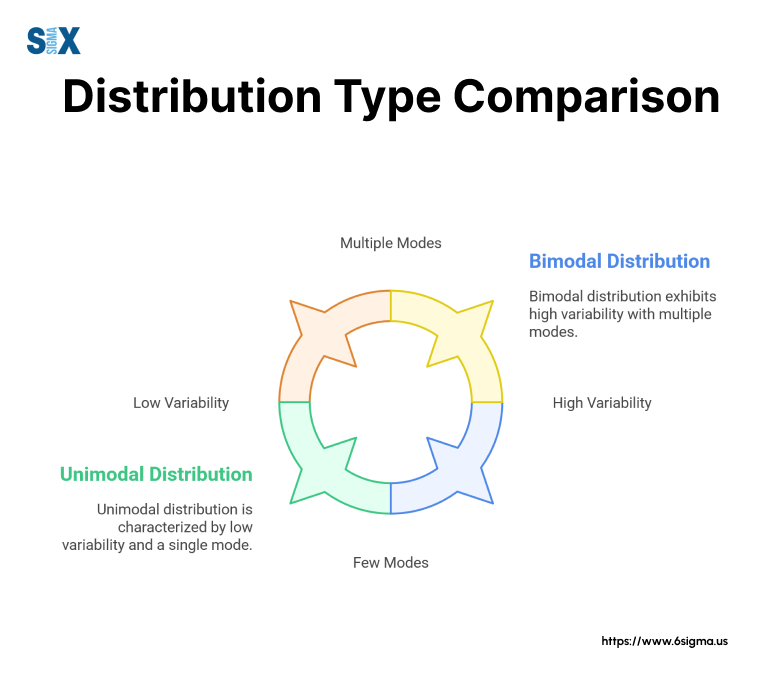
Key Differences Between Distribution Types
| Characteristic | Unimodal Distribution | Bimodal Distribution |
|---|---|---|
| Number of Peaks | Single peak | Two distinct peaks |
| Central Tendency | One clear center | Two local centers |
| Data Pattern | Continuous decline from peak | Valley between peaks |
| Statistical Analysis | Standard methods apply | Specialized techniques needed |
| Population Type | Single population | Mixed populations |
Statistical Implications And Analysis Methods
The choice between unimodal and bimodal analysis affects:
Data Treatment:
Unimodal data often allows for standard statistical tests, while bimodal data requires specialized approaches like mixture modeling or population separation techniques.
Interpretation Requirements:
Unimodal distributions typically indicate a single underlying process. Bimodal patterns suggest multiple processes or populations requiring separate analysis.
Selecting The Right Distribution Model
Choose unimodal analysis when:
- Data clusters around one central value
- Population appears homogeneous
- Standard statistical tests apply
- Simple interpretation suffices
Select bimodal analysis when:
- Two distinct groups emerge
- Mixed populations exist
- Complex patterns appear
- Separate treatment needed
Practical Application Guidelines
The selection process depends on:
Research Goals:
- Population identification needs
- Required analysis depth
- Expected outcomes
- Reporting requirements
Data Characteristics:
- Sample size considerations
- Measurement precision
- Population diversity
- Pattern clarity
Impact On Decision Making
Distribution type influences:
- Statistical test selection
- Data interpretation methods
- Result reporting approaches
- Action recommendations
Understanding these differences helps professionals:
- Design better studies
- Choose appropriate methods
- Draw accurate conclusions
- Make informed decisions
This comparative analysis provides the foundation for selecting appropriate statistical approaches and ensuring accurate data interpretation across various applications.
Turn complex data into clear, actionable insights and Enhance Your Distribution Analysis with Minitab Essentials
Applications in Six Sigma and Process Improvement
Six Sigma methodology relies heavily on understanding both unimodal and bimodal distributions to optimize process performance and quality control.
These statistical patterns provide crucial insights for process improvement initiatives and decision-making protocols.

Role In Quality Control Systems
Quality control processes utilize distribution analysis to monitor and improve manufacturing outcomes.
Unimodal distributions typically indicate stable processes, while bimodal patterns might signal equipment issues or process variations.
Process monitoring requires:
- Regular data collection
- Pattern recognition
- Variation analysis
- Control limit establishment
Process Capability Analysis
Distribution patterns significantly impact process capability calculations.
The presence of unimodal or bimodal characteristics affects:
Capability Indices:
- Cp and Cpk calculations
- Performance predictions
- Specification limits
- Process centering
Six Sigma Implementation Strategy
DMAIC methodology incorporates distribution analysis:
- Define: Identify process patterns
- Measure: Collect distribution data
- Analyze: Evaluate modal characteristics
- Improve: Address distribution issues
- Control: Maintain optimal patterns
Decision-Making Protocols
Distribution patterns guide critical decisions in:
Process Adjustment:
- Equipment calibration needs
- Operator training requirements
- Material specification changes
- Production scheduling
Quality Improvements:
- Root cause identification
- Corrective action planning
- Prevention strategy development
- Performance monitoring
Statistical Process Control (SPC)
SPC charts reveal:
- Process stability
- Distribution changes
- Special cause variations
- Control limit violations
These indicators help quality teams:
- Detect process shifts
- Identify improvement opportunities
- Implement corrective actions
- Monitor results
Practical Implementation Steps
Quality improvement teams should:
- Establish baseline measurements
- Monitor distribution patterns
- Analyze variation sources
- Implement control measures
The integration of distribution analysis in Six Sigma:
- Enhances process understanding
- Improves decision accuracy
- Supports continuous improvement
- Validates process changes
This systematic approach ensures effective process control and sustainable quality improvements across manufacturing and service operations.
Identifying and Analyzing Distribution Types
Accurate identification of unimodal and bimodal distributions requires systematic analysis and careful consideration of data patterns.
This process ensures proper statistical treatment and valid conclusions from data analysis.
Initial Data Assessment Steps
The identification process begins with visual inspection and moves through quantitative analysis:
- Plot the data distribution
- Examine peak characteristics
- Calculate basic statistics
- Apply formal testing methods
Statistical Testing Methods
Several statistical tests help confirm distribution type:
Normality Tests:
- Shapiro-Wilk test
- Anderson-Darling test
- Kolmogorov-Smirnov test
- Q-Q plot analysis
Bimodality Tests:
- Hartigan’s dip test
- Bimodality coefficient
- Mixture model analysis
- Peak detection algorithms
Common Analysis Pitfalls
Data analysts should avoid these frequent mistakes:
Sample Size Issues:
Too few data points can mask true distribution patterns. Ensure adequate sample sizes for reliable analysis.
Binning Problems:
Improper histogram bin sizes might hide or create false peaks. Adjust bin widths systematically.
Outlier Effects:
Extreme values can distort distribution shape. Evaluate outliers carefully before exclusion.
Distribution Analysis Best Practices
Follow these guidelines for accurate analysis:
Data Preparation:
- Clean data thoroughly
- Remove invalid entries
- Handle missing values
- Standardize measurements
Analysis Approach:
- Use multiple visualization methods
- Apply appropriate statistical tests
- Document analysis steps
- Validate results
Advanced Analysis Techniques
Modern tools offer sophisticated analysis options:
Software Solutions:
- Statistical packages
- Visualization tools
- Machine learning algorithms
- Distribution fitting programs
These tools help:
- Automate analysis steps
- Improve accuracy
- Save time
- Provide documentation
Result Interpretation Guidelines
Consider these factors when interpreting results:
Context Evaluation:
- Domain knowledge application
- Historical data comparison
- Process understanding
- Expected patterns
Decision Making:
- Evidence assessment
- Confidence level consideration
- Impact analysis
- Action planning
This structured approach to distribution identification ensures reliable results and supports sound statistical decision-making across various applications.
Common Misconceptions and FAQs
Statistical distribution analysis often generates confusion among practitioners and students alike.
Common Statistical Errors
Many analysts mistake local fluctuations for true modes. Proper statistical testing helps distinguish genuine peaks from random variation.
Small samples might not reveal true distribution patterns. Larger datasets typically provide more reliable modal characteristics.
Applying inappropriate statistical tests can lead to incorrect conclusions about distribution type and characteristics.
Expert Clarifications
Statistical experts emphasize that proper classification requires both visual inspection and formal testing methods.
Analysis Requirements:
- Sufficient sample size
- Appropriate testing methods
- Context consideration
- Proper documentation
Technical Considerations
Poor data quality can mask true distribution patterns. Ensure proper data collection and cleaning procedures.
Test selection affects the ability to detect true modality. Choose tests appropriate for sample size and data characteristics.
Practical Application Issues
Implementation Challenges:
- Software limitations
- Resource constraints
- Time pressures
- Expertise gaps
Solution Approaches:
- Use validated methods
- Apply appropriate tools
- Seek expert review
- Document decisions
Future Considerations
New analytical tools and methods continue to improve distribution analysis accuracy and efficiency.
Statistical methods and understanding of distributions continue to advance with new research and applications.
These clarifications help analysts:
- Avoid common mistakes
- Choose appropriate methods
- Interpret results correctly
- Make informed decisions
Understanding these common issues and their solutions ensures more accurate statistical analysis and better decision-making outcomes.
Frequently Asked Questions
A. A unimodal mode represents a single peak in a data distribution, indicating one most frequent value or central tendency in the dataset. Examples include test scores in a single class or height measurements in a specific age group.
A bimodal mode shows two distinct peaks in the data distribution, suggesting two separate groups or populations within the dataset. Each peak represents a local maximum of frequency.
A: Unimodal distributions show one peak with values decreasing on both sides, while bimodal distributions display two separate peaks with a valley between them.
A: Unimodal distributions typically use standard statistical measures (mean, median, mode), while bimodal distributions often require specialized analytical techniques like mixture modeling.
A: Common examples include:
– Rush hour traffic patterns (morning and evening peaks)
– Age distribution in college towns (students and permanent residents)
– Shopping behavior (weekend and weekday patterns)
– Work shift schedules (day and night shifts)
A: Yes, distributions can shift between unimodal and bimodal patterns based on changes in underlying populations or processes.
SixSigma.us offers both Live Virtual classes as well as Online Self-Paced training. Most option includes access to the same great Master Black Belt instructors that teach our World Class in-person sessions. Sign-up today!
Virtual Classroom Training Programs Self-Paced Online Training Programs


