Attribute Data vs Variable Data: Master the Difference for Quality Excellence
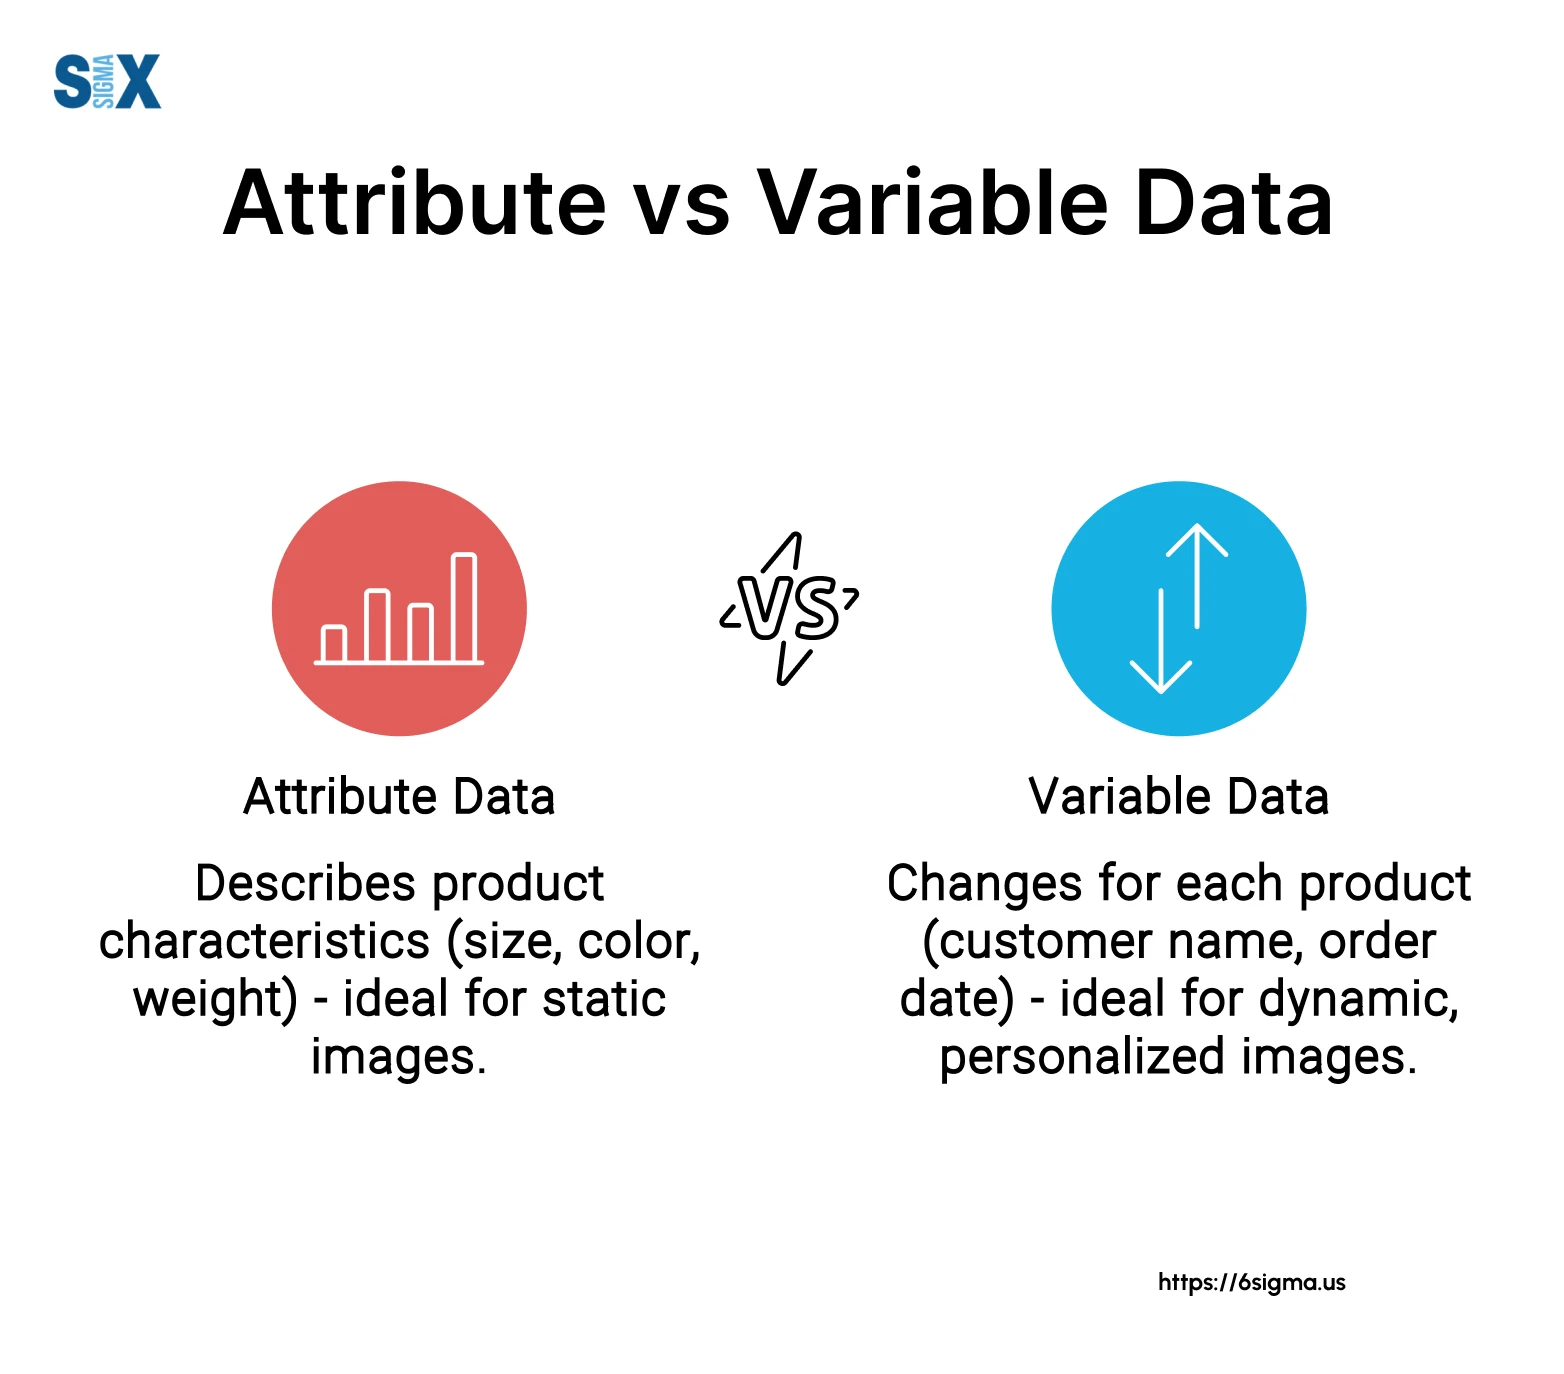
Attribute data also referred to as “go/no-go” information, is qualitative and describes whether a product or process meets a specific requirement or not.
It is binary, indicating either conformance or nonconformance. On the other hand, variable data, known as “measurement information“, is quantitative and involves continuous measurements of characteristics such as length, weight, temperature, or time.
Key Highlights
- Understand the differences between attribute data vs variable data
- Explore the applications and use cases of attribute data vs variable data
- Learn about Measurement System Analysis (MSA) and its role
- Discover effective data collection and measurement techniques
- Gain insights into analysis and decision-making processes
- Examine best practices and considerations
- Leverage industry-specific examples and scenarios
Understanding Attribute Data and Variable Data: Key Differences
This understanding serves as the foundation for effective data analysis, informed decision-making, and the selection of appropriate statistical tools and methodologies.
What is Attribute Data?
Attribute data, often referred to as “go/no-go” information, is qualitative and represents characteristics that can be classified into distinct categories or binary states.
This type of data describes whether a product or process meets a specific requirement or not, without providing quantitative measurements.
Attribute data is typically used to assess nonconformities, which are defects or occurrences that should not be present but are, as well as nonconforming units, which are items that fail to meet predetermined specifications.
Examples of attribute data include pass/fail tests, defective/non-defective products, and the presence or absence of specific features or characteristics.
What is Variable Data?
In contrast, variable data is quantitative and involves continuous measurements of specific characteristics or features.
Also known as “measurement information“, variable data is represented by numerical values that can vary along a continuous scale.
This type of data is commonly used to measure and analyze characteristics such as length, weight, temperature, time, strength, thickness, or pressure.
Variable data provides more granular information than attribute data, allowing for a more detailed understanding of the process or product under investigation.
Applications and Use Cases
Both attribute data and variable data play crucial roles in various applications and use cases within the realm of quality management and process improvement.
Control Charts for Attribute Data
One of the primary applications of attribute data is in the construction of control charts, which are powerful tools for monitoring and detecting process variations.
Attribute data is typically analyzed using specialized control charts, such as:
- p-charts: Used when the number of inspected units varies and the focus is on the proportion of nonconforming units.
- np-charts: Used when the number of inspected units is constant, and the focus is on the count of nonconforming units.
- u-charts: Utilized when the number of nonconformities per unit is counted, and the number of inspected units varies.
- c-charts: Employed when the number of nonconformities is counted, and the number of inspected units is constant.
These control charts enable quality professionals to identify and investigate special cause variations, implement corrective actions, and maintain process stability.
Control Charts for Variable Data
Similarly, variable data is widely used in the creation of control charts for monitoring and controlling process performance. Common control charts for variable data include:
- X-bar charts: Used to monitor the process mean or average over time.
- R charts (Range charts): Used to monitor the process variation or range over time.
- S charts (Standard deviation charts): Used to monitor the process standard deviation over time.
These control charts provide valuable insights into process stability, capability, and the need for potential adjustments or improvements.
Measurement System Analysis (MSA)
Measurement System Analysis (MSA) is a critical component in the realm of quality management, as it evaluates the capability and performance of the measurement systems used to collect attribute and variable data.
Attribute MSA
When conducting an MSA for attribute data, several key factors are assessed:
- Bias: The difference between the observed average of measurements and the reference value.
- Linearity: The change in bias over the normal operating range.
- Stability: The variation in measurements obtained on the same master or parts over an extended period, indicating potential drift.
- Repeatability: The variations in measurements obtained by a single appraiser when measuring the same characteristic multiple times.
- Reproducibility: The variation in measurements made by different appraisers using the same measurement system.
Evaluating these factors helps identify potential sources of error and ensures the integrity of the attribute data collected.
Variable MSA
For variable data, the MSA process typically involves a gauge repeatability and reproducibility (gauge R&R) study, which assesses the measurement system’s capability to accurately and consistently measure product or process characteristics.
Key considerations in a variable MSA include:
- Measurement error: The difference between the observed measurement and the true value, which can arise from various sources.
- Type I error: The risk of incorrectly identifying a good part as defective (false alarm or producer’s risk).
- Type II error: The risk of incorrectly identifying a defective part as good (missed detection or consumer’s risk).
By quantifying these factors, quality professionals can determine if the measurement system is capable of distinguishing between different parts.
Data Collection and Measurement Techniques
Accurate and reliable data collection is fundamental to effective quality management and process improvement initiatives.
The techniques employed for data collection and measurement can vary depending on whether attribute or variable data is being gathered.
Attribute Data Measurement
Attribute data measurement often relies on human senses or specialized gauges and fixtures. Common techniques include:
- 5 senses (sight, hearing, touch, smell, taste): Visual inspections, auditory checks, tactile assessments, olfactory evaluations, and taste tests can be used to determine if a product or process meets specific requirements.
- Fitment gauges: These gauges are designed to assess whether a part or component fits within predefined dimensional tolerances.
- Go/no-go gauges: Similar to fitment gauges, these gauges provide a binary assessment of whether a part conforms to specified dimensions or not.
The selection of appropriate measurement techniques for attribute data depends on the nature of the characteristic being evaluated and the available resources.
Variable Data Measurement
Variable data measurement often requires the use of precise measuring instruments to capture quantitative information accurately.
Common instruments and techniques include:
- Vernier calipers and micrometers: Used for precise linear measurements of length, diameter, or thickness.
- Coordinate Measuring Machines (CMMs): Highly accurate and versatile instruments capable of measuring complex geometries and dimensions.
- Hardness testers, pressure gauges, and other specialized instruments: Depending on the characteristics being measured, industry-specific instruments may be employed.
Proper calibration, maintenance, and operator training are essential to ensure the reliability and accuracy of variable data measurements.
Analysis and Decision-Making
Once attribute and variable data have been collected, the next step is to analyze the data and make informed decisions based on the analysis results.
The analysis techniques and decision-making processes differ between attribute data vs variable data, reflecting their distinct characteristics.
Attribute Data Analysis
Attribute data analysis typically involves defect classification and nonconformity analysis. Key aspects include:
- Defect classification: Categorizing and identifying the types of defects or nonconformities present in the product or process.
- Nonconformity analysis: Evaluating the frequency, severity, and potential causes of nonconformities to identify opportunities for improvement.
A key aspect of this analysis is root cause analysis, which aims to identify and address the underlying causes of issues.
Attribute data analysis often involves statistical techniques such as Pareto analysis, cause-and-effect diagrams, and failure mode and effects analysis (FMEA) to prioritize and address nonconformities effectively.
These techniques are integral to methodologies like Six Sigma, and our Six Sigma certification programs provide in-depth training on their application in quality improvement projects.
Variable Data Analysis
Variable data analysis focuses on understanding central tendency, variation, and the normality of the data. Key aspects include:
- Central tendency: Calculate measures of central tendency, such as the mean or median, to understand the typical or average value of the measured characteristic.
- Variation: Evaluating the spread or dispersion of the data using measures like range, standard deviation, or variance to assess process stability and capability.
- Normality: Assessing whether the data follows a normal distribution pattern, as many statistical techniques assume normality.
Variable data analysis often involves the use of statistical process control (SPC) techniques, a core competency covered in Six Sigma Green Belt certification programs for quality professionals, capability studies, and hypothesis testing to identify and address sources of variation and ensure process conformance.
Best Practices and Considerations
To ensure the effective utilization of attribute and variable data in quality management and process improvement initiatives, it is essential to follow best practices and consider various factors that influence data quality, integrity, and the appropriate selection of data types.
Measurement System Evaluation
Evaluating the measurement system is crucial to ensure the accuracy and reliability of the data collected. Key considerations include:
- Sources of error: Identifying and mitigating potential sources of error, such as those related to standards, work pieces, instruments, personnel, procedures, or the environment (SWIPE).
- Measurement system analysis: Conducting appropriate measurement system analyses (MSAs) to quantify and address measurement errors, biases, and variations.
Regular measurement system evaluations and calibrations help maintain data integrity and enable informed decision-making based on reliable information.
Data Quality and Integrity
Maintaining high data quality and integrity is essential for effective analysis and decision-making. Key factors to consider include:
- Accuracy: Ensuring that measurements or observations closely reflect the true value or state of the characteristic being evaluated.
- Precision: Minimizing the variability or spread of repeated measurements under the same conditions.
- Resolution: Selecting measurement systems with appropriate resolution or sensitivity to capture meaningful variations in the data.
Implementing robust data collection processes, operator training, and regular calibration and maintenance routines can help ensure data quality and integrity.
Choosing Attribute Data vs Variable Data
The choice between using attribute data vs variable data often depends on the specific problem context and business objectives.
Factors to consider include:
- Problem context: Understanding the nature of the characteristic being evaluated, the required level of detail, and the available resources.
- Business objectives: Aligning the data type with the organization’s goals, such as defect reduction, process optimization, or compliance with regulatory requirements.
In some cases, a combination of attribute data and variable data may be necessary to gain a comprehensive understanding of the process or product under investigation.
Conclusion
The ability to differentiate between attribute data vs variable data is a fundamental skill.
By mastering the key differences, applications, and analysis techniques associated with these data types, quality professionals can effectively navigate the complexities of data-driven decision-making.
Attribute data, with its binary nature, provides valuable insights into conformance and nonconformities, enabling targeted improvements and defect reduction efforts.
Variable data, on the other hand, offers a quantitative perspective, allowing for in-depth analyses of process stability, capability, and optimization opportunities.
Organizations can unlock the full potential of their quality management and process improvement initiatives, by training teams in advanced methodologies like a Six Sigma Black Belt certification, driving continuous improvement, enhancing customer satisfaction, and achieving operational excellence.
SixSigma.us offers both Live Virtual classes as well as Online Self-Paced training. Most option includes access to the same great Master Black Belt instructors that teach our World Class in-person sessions. Sign-up today!
Virtual Classroom Training Programs Self-Paced Online Training Programs