ANOVA F Value: Mastering Signal-to-Noise Ratio for Data Analysis
Stats analysis is so important for improving and optimizing workflows, a core focus in many six sigma certification programs, and ANOVA is a powerful technique. It allows comparing averages across multiple groups or sets of data. A key element in it is the ANOVA F value.
This statistic serves as the main indicator of whether differences seen in group averages are statistically meaningful or just due to random variation.
The F value, sometimes called the F ratio or F stat, measures the ratio between the variance among group averages (the signal) and variance within each group (the noise).
Mastering the ANOVA F value concept is crucial, particularly for professionals pursuing data-driven roles often validated by a six sigma certification, as it allows drawing reliable conclusions about average equality and provides a framework for grasping assumptions, deciphering results, and choosing follow-up tests well.
In this article, we’ll unpack the F value meaning and how it helps tease out the signal from the noise. My goal is to equip you with the understanding and skills to maximize ANOVA for refining processes based on solid facts.
Key Highlights
Key aspects of the ANOVA F value:
- Understanding the fundamentals of the F statistic, including its relationship to the F distribution and critical values.
- Examining how the F value is calculated, breaking down the components of between-group and within-group variation.
- Interpreting the F value in the context of hypothesis testing, p-values, and significance levels.
- Exploring the assumptions underlying ANOVA, such as normality and homogeneity of variances, and best practices for ensuring their validity.
- Delving into advanced topics like post hoc tests, multiple comparisons, and familywise error rates.
- Showcasing real-world applications and examples of one-way, two-way, and factorial ANOVA, as well as variations like repeated measures and non-parametric alternatives.
- Providing insights into industry best practices, tips, and potential pitfalls to avoid when conducting ANOVA and interpreting F values.
By the end of this article, you will have a solid grasp of the ANOVA F value meaning, its calculations, and its pivotal role in drawing accurate conclusions from your data.
What is the ANOVA F Value?
Among the essential tools in our arsenal is the Analysis of Variance (ANOVA), a powerful technique for comparing the means of multiple groups or populations.
At the heart of ANOVA lies the F value, a statistic that serves as the cornerstone for determining whether the observed differences in group means are statistically significant or simply due to random variation.
Organizations investing in Six Sigma White Belt certification often start with foundational tools like ANOVA to build a culture of data literacy.
Understanding the F Statistic
The F value, often referred to as the F ratio or F statistic, is a measure of the ratio between the variance among group means (signal) and the variance within each group (noise).
It’s a unitless value that quantifies the degree to which the observed differences in group means exceed the expected variation within groups.
To grasp the F statistic fully, we must understand its relationship with the F distribution and critical values. The F distribution is a probability distribution that describes the behavior of the F statistic under the null hypothesis of equal means.
It’s a family of curves shaped by the degrees of freedom associated with the numerator and denominator of the F ratio.
The F critical value is a specific value from the F distribution that serves as a benchmark for determining statistical significance.
If the calculated F value exceeds the critical value, we can reject the null hypothesis and conclude that the differences in group means are statistically significant.
Importance of the F Value in ANOVA
The F value is pivotal in ANOVA because it allows us to draw reliable conclusions about the equality of means across multiple groups.
By comparing the variance among group means to the variance within each group, the F value provides a quantitative measure of the signal-to-noise ratio.
When the F value is large, it indicates that the differences in group means are substantially greater than what could be expected due to random variation alone.
Conversely, a small F value suggests that the observed differences in means are likely attributable to chance fluctuations within the groups.
How the ANOVA F Value Works
To fully comprehend the F value’s role in ANOVA, we must delve into its calculation and the components that make up this pivotal statistic.
By understanding the numerator and denominator of the F ratio, we can gain insights into the factors that influence its magnitude and, ultimately, our ability to draw meaningful conclusions from the analysis.
The Numerator: Between-Group Variance
The numerator of the F ratio, often referred to as the “mean square between” or “treatment sum of squares“, quantifies the spread of the group’s means around the overall mean.
It measures the degree to which the group means differ from one another, capturing the signal or the variation we’re interested in detecting.
A larger spread of group means corresponds to a higher between-group variance, indicating a stronger signal of potential differences among the populations being studied.
This component of the F ratio is particularly sensitive to the presence of outliers or extreme values in the group means, as they can substantially increase the numerator’s magnitude.
The Denominator: Within-Group Variance
The denominator of the F ratio, known as the “mean square error” or “within-group sum of squares”, quantifies the variability within each group.
It represents the random error or noise present in the data, capturing the natural variation that exists even within homogeneous groups.
A smaller within-group variance is desirable, as it indicates that the data points within each group are tightly clustered around their respective group means. This reduces the amount of unexplained variation, increasing our ability to detect true differences among the group means if they exist.
It’s important to note that the within-group variance is influenced by factors such as measurement error, uncontrolled variables, and inherent variability in the process or system under study.
Interpreting the ANOVA F Value
The F value is calculated as the ratio of the between-group variance to the within-group variance.
A large F value indicates that the differences in group means are substantially greater than the variability within each group, suggesting that the observed differences are unlikely to be due to chance alone.
Conversely, a small F value implies that the differences in group means are comparable to the natural variation within the groups, making it difficult to conclude that the observed differences are statistically significant.
Interpreting the F value in the context of hypothesis testing is crucial. By comparing the calculated F value to the critical value from the F distribution, we can determine whether to reject or fail to reject the null hypothesis of equal means across all groups.
Understanding F Distributions and P-Values
While the F value provides a quantitative measure of the signal-to-noise ratio in ANOVA, interpreting its significance requires an understanding of F distributions and their associated p-values.
These concepts form the foundation for drawing robust statistical conclusions and making informed decisions based on the ANOVA results.
Sampling Distributions and F Curves
The F distribution is a probability distribution that describes the behavior of the F statistic under the null hypothesis of equal means.
It is derived from the ratio of two independent chi-squared distributions, each scaled by their respective degrees of freedom.
The shape of the F distribution curve is determined by the degrees of freedom associated with the numerator and denominator of the F ratio.
These degrees of freedom reflect the number of independent pieces of information used to estimate the between-group and within-group variances, respectively.
Calculating P-Values from F-Values
The p-value associated with an F value is the probability of observing a value as extreme or more extreme than the calculated F value, assuming the null hypothesis is true.
It quantifies the likelihood of obtaining the observed results by chance alone.
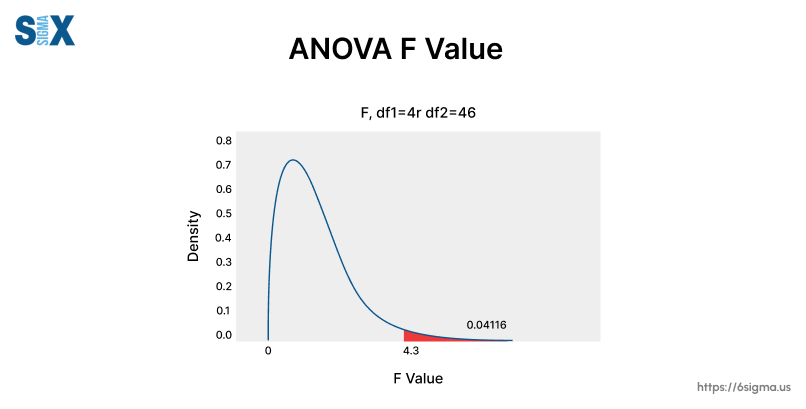
To calculate the p-value, we integrate the area under the F distribution curve beyond the calculated F value.
A smaller p-value indicates that the observed F value is less likely to occur under the null hypothesis, providing stronger evidence against the null hypothesis of equal means.
The significance level, typically denoted by the Greek letter alpha (α), is a predetermined threshold that defines the maximum acceptable probability of incorrectly rejecting the null hypothesis when it is true (a Type I error).
By comparing the p-value to the chosen significance level (e.g., 0.05 or 0.01), we can decide whether to reject or fail to reject the null hypothesis.
Suppose the p-value is less than or equal to the significance level. In that case, we reject the null hypothesis and conclude that there is statistically significant evidence of differences among the group means.
Assumptions and Best Practices for ANOVA F Value
While the F value and its associated p-value provide a powerful framework for concluding ANOVA, the validity of these inferences hinges on several key assumptions.
Ensuring these assumptions are met and following best practices is crucial for obtaining reliable and defensible results.
Normality and Equal Variances
ANOVA is based on the assumption that the data within each group are normally distributed and that the variances of the groups are equal (homogeneity of variance).
Violations of these assumptions can compromise the accuracy of the F test and increase the risk of drawing incorrect conclusions. For teams focused on quality improvement, pairing ANOVA with root cause analysis training ensures that process variations are not just identified but systematically addressed.
To assess the normality assumption, practitioners can employ various statistical tests, such as the Shapiro-Wilk test or graphical methods like normal probability plots.
Deviations from normality can be mitigated through data transformations or the use of non-parametric alternatives, such as the Kruskal-Wallis test.
The assumption of equal variances, also known as homoscedasticity, can be evaluated using Levene’s test or Bartlett’s test. If this assumption is violated, alternative methods like Welch’s ANOVA or non-parametric tests may be more appropriate.
Selecting Alpha Levels and Sample Sizes
The significance level (alpha) and sample size are critical factors that influence the statistical power and sensitivity of ANOVA.
A lower alpha level (e.g., 0.01) reduces the probability of committing a Type I error (rejecting the null hypothesis when it is true) but increases the likelihood of a Type II error (failing to reject the null hypothesis when it is false).
Larger sample sizes generally increase statistical power, making it easier to detect true differences among group means. However, obtaining larger samples can be costly or impractical in some situations.
Interpreting ANOVA F Value Results
Once the ANOVA has been conducted and the F value and associated p-value have been calculated, the next step is to interpret the results and draw meaningful conclusions.
This process involves examining the ANOVA table, understanding the degrees of freedom, and potentially conducting post hoc tests to identify specific differences among groups.
For teams managing multiple projects, Six Sigma Black Belt certification offers strategies to scale statistical analysis across departments while maintaining rigor
ANOVA Tables and F Statistics
The ANOVA table is a concise summary of the analysis, presenting the key statistics and their associated degrees of freedom. The F statistic, along with its corresponding p-value, is typically displayed prominently in this table.
The degrees of freedom reflect the number of independent pieces of information used to estimate the variances in the numerator and denominator of the F ratio. They are directly related to the number of groups and the sample sizes within each group.
Interpreting the F statistic and its associated p-value in the context of the degrees of freedom is crucial. These degrees of freedom determine the critical value of the F distribution, against which the calculated F value is compared.
Post Hoc Tests and Multiple Comparisons
While ANOVA can determine whether there are statistically significant differences among the group means, it does not explicitly identify which specific pairs of means differ.
To address this limitation, practitioners often employ post hoc tests, such as Tukey’s Honest Significant Difference (HSD) test or Dunnett’s test.
These tests involve pairwise comparisons of the group means, allowing researchers to pinpoint the specific differences while controlling for the familywise error rate (FWER). The FWER represents the probability of making at least one Type I error (false positive) when conducting multiple comparisons.
Proper adjustment of the significance level for these multiple comparisons is essential to maintain the overall desired level of confidence and avoid inflated Type I error rates.
Applications and Examples of ANOVA F Value
The ANOVA and its associated F value have found widespread applications across various industries and domains, serving as a powerful tool for comparing means and driving data-driven decision-making.
One-Way ANOVA in Practice
One of the most common applications of ANOVA is in the context of one-way analyses, where a single factor or treatment is being investigated.
For instance, in manufacturing, One-way ANOVA is frequently used alongside Lean fundamentals to identify waste and variability, ensuring processes meet Six Sigma standards. Professionals holding a Six Sigma Green Belt certification or Six Sigma Black Belt certification frequently utilize ANOVA in such projects to drive data-backed improvements.
Similarly, in educational research, a one-way ANOVA might be used to assess whether there are significant differences in test scores among students taught using different instructional methods.
Two-Way and Factorial ANOVA
As the complexity of research questions increases, more advanced forms of ANOVA become necessary.
Two-way ANOVA, for instance, allows researchers to investigate the main effects of two independent variables, as well as their potential interaction effects.
In market research, a two-way ANOVA could be employed to assess the impact of product packaging and price point on consumer purchase intentions, while also examining whether these two factors interact in influencing consumer behavior.
Conclusion
Truly understanding the ANOVA F value is essential for anyone wanting to leverage this powerful stats method.
The F value quantitatively measures the signal versus noise ratio, allowing conclusions on whether differences in group averages are statistically important or down to randomness.
By comparing variance between group averages to variance within groups, the F value provides a strong foundation for reliable conclusions on average equality.
Yet interpreting F isn’t straightforward. It requires a deep grasp of F distributions, p-values, and the interplay between significance levels, sample sizes, and statistical power.
Assumption compliance for normality and homogeneous variances also matters, as their violation jeopardizes ANOVA result validity.
As data analysis complexity grows, F-value mastery remains extremely valuable.
For professionals aiming to formalize their expertise, pursuing Six Sigma Black Belt certification provides advanced training in ANOVA and other statistical tools critical for leading complex process improvement projects.
Be it one-way testing, examining main effects/interactions in factorial designs, or advanced options, a solid grip on this key stat equips professionals to extract meaningful insights from their numbers.
It arms you with the knowledge and skills to leverage one of stats most powerful tools for optimization guided by solid facts, often complementing efficiency principles covered in our Lean Introduction.
In other words, take the time to really understand the F value concept. It arms you with the knowledge and skills to leverage one of stats most powerful tools for optimization guided by solid facts.
SixSigma.us offers both Live Virtual classes as well as Online Self-Paced training. Most option includes access to the same great Master Black Belt instructors that teach our World Class in-person sessions. Sign-up today!
Virtual Classroom Training Programs Self-Paced Online Training Programs


