Activity Network Diagram: A Critical Tool in Lean Six Sigma Project Management
An Activity Network Diagram serves as a visual roadmap that transforms complicated project sequences into manageable, actionable steps.
Project managers and process improvement specialists face complex challenges in planning and executing projects efficiently.
Key Highlights
- Maps critical paths in project flow
- Shows task dependencies and relationships
- Identifies potential bottlenecks and delays
- Enables precise resource allocation planning
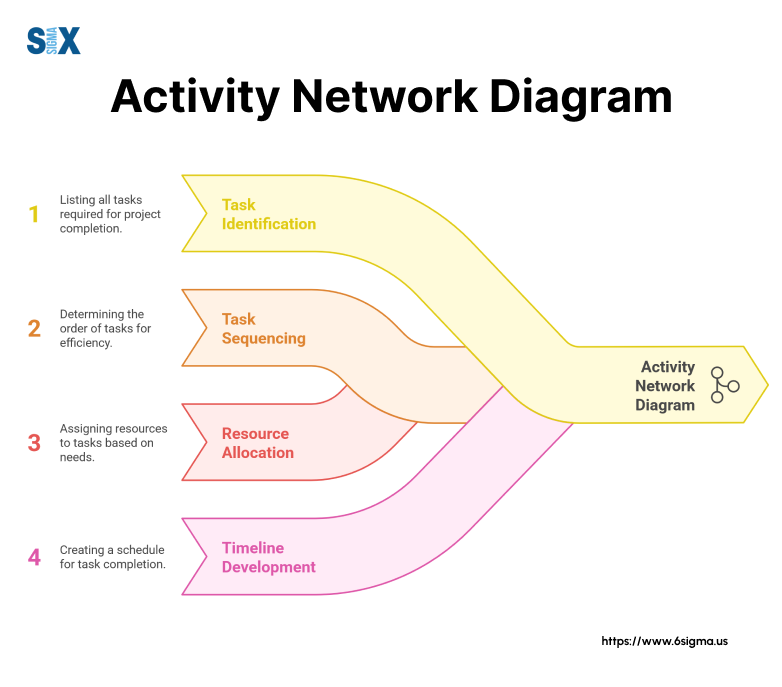
What Is Activity Network Diagram In Six Sigma
An Activity Network Diagram functions as a crucial planning tool in Six Sigma methodology, representing project activities and their interconnections through nodes and directional arrows.
This visual technique enables project managers to map out the entire process flow while identifying critical paths and potential bottlenecks.
Core Concepts And Definitions
Within Six Sigma projects, Activity Network Diagrams serve multiple purposes.
The diagram breaks down complex processes into manageable segments, showing both parallel and sequential activities.
Project teams use these diagrams to calculate expected completion times, determine task dependencies, and allocate resources effectively.
The structure follows a logical flow where each activity connects to others through defined relationships. These connections help teams understand which tasks must finish before others can begin, which can run simultaneously, and which might cause delays in the project timeline.
Origins In Project Management
Activity Network Diagrams emerged from the need to manage increasingly complex projects in the 1950s. The technique evolved alongside other project management tools like PERT charts and Gantt diagrams. Six Sigma practitioners later adopted this method, enhancing it with statistical analysis and process improvement principles.
Role In Six Sigma Implementation
In Six Sigma projects, Activity Network Diagrams play several key roles:
First, they support the Define phase by mapping process steps and identifying improvement opportunities. During the Measure phase, these diagrams help teams track progress and collect data at crucial points in the process.
Second, they guide the Analyze phase by highlighting process bottlenecks and inefficiencies. Teams use this information to develop targeted solutions during the Improve phase.
Finally, during the Control phase, Activity Network Diagrams help maintain process improvements by providing a clear visual reference for standardized procedures.
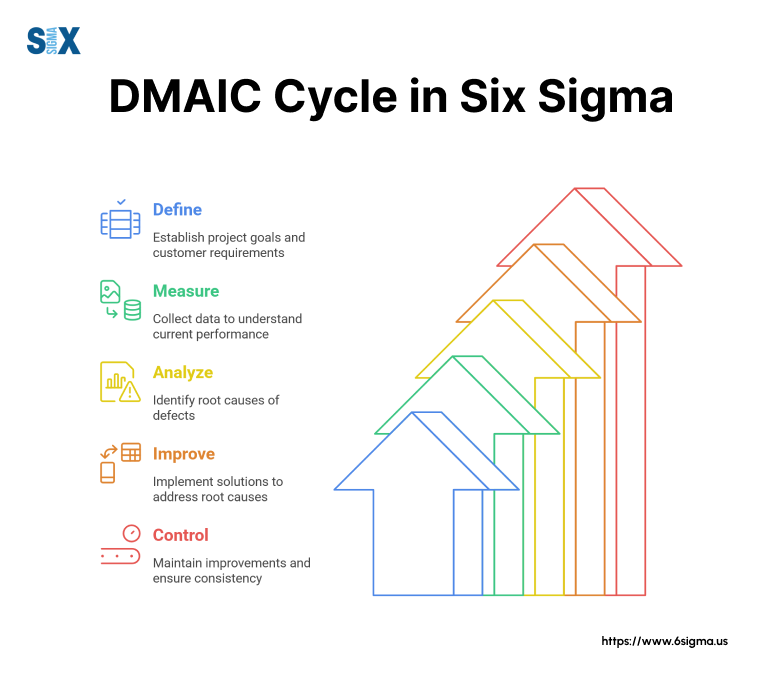
Integration With DMAIC Methodology
The diagram’s flexibility makes it valuable throughout the DMAIC cycle. Project managers use it to:
- Track progress across different process stages
- Monitor improvement initiatives
- Document process changes
- Maintain quality standards
By incorporating statistical measures and Six Sigma metrics, these diagrams become powerful tools for process optimization and quality improvement. They help teams maintain focus on critical factors while working toward project goals.
Components Of An Activity Network Diagram
Project managers rely on several key elements within Activity Network Diagrams to effectively plan and monitor project progress.
These components work together to create a clear visual representation of project flow and dependencies.
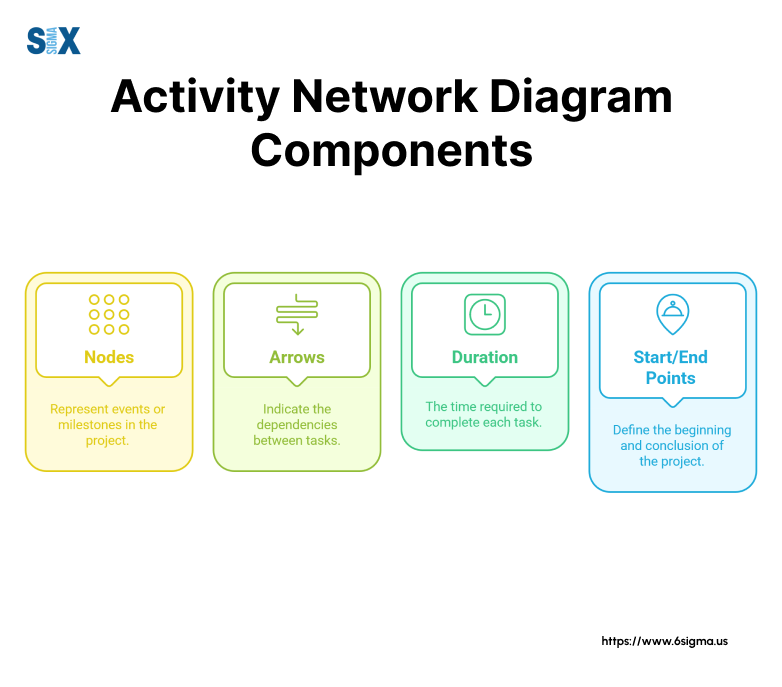
Nodes And Activity Representation
Nodes form the basic building blocks of an Activity Network Diagram, representing individual tasks or milestones. Each node contains essential information:
- Task description
- Expected duration
- Required resources
- Start and finish dates
Project teams label these nodes with unique identifiers, making it easier to track and reference specific activities throughout the project lifecycle.
Dependency Relationships And Connections
Arrows between nodes show how tasks relate to each other. Four main types of dependencies exist:
Finish-to-Start connections represent the most common relationship, where one task must finish before another begins. For example, in manufacturing, quality inspection must finish before packaging starts.
Start-to-Start relationships allow tasks to begin simultaneously. Consider multiple training sessions running parallel to each other.
Finish-to-Finish dependencies require tasks to complete together, often seen in coordinated launch activities.
Start-to-Finish relationships, though rare, indicate that a successor activity cannot finish until its predecessor starts.
Time Estimation And Duration Analysis
Project managers use three time estimates for each activity:
- Optimistic time: Best-case scenario
- Most likely time: Normal conditions
- Pessimistic time: Worst-case scenario
These estimates help calculate the expected duration using PERT analysis, providing more accurate project timelines. Teams can then adjust resources and schedules based on these calculations.
Critical Path Identification Process
The critical path determines the shortest possible project completion time. To identify it:
First, calculate the earliest start and finish times for each activity, moving forward through the network.
Next, determine the latest start and finish times, working backward from the project end date.
Finally, identify activities with zero float time – these form the critical path. Any delay in these activities directly impacts the project completion date.
Resource Allocation Markers
Modern Activity Network Diagrams often include resource indicators showing:
- Required skill sets
- Equipment needs
- Personnel assignments
- Cost estimates
These markers help project managers balance resources across activities and identify potential constraints or conflicts.
By understanding these components, project teams can create effective Activity Network Diagrams that guide project execution and support decision-making throughout the project lifecycle.
Six Sigma Project Management And Activity Network Diagrams
Activity Network Diagrams play a vital role in Six Sigma project management by providing structured visualization of process improvements.
These tools integrate seamlessly with DMAIC methodology, offering clear pathways for project execution and control.
Integration With DMAIC Methodology
During the Define phase, Activity Network Diagrams help teams map current processes and identify improvement opportunities. Project managers use these diagrams to outline project scope, timelines, and resource requirements.
In the Measure phase, the diagrams track data collection points and process metrics. Teams mark specific nodes where measurements occur, ensuring systematic data gathering for analysis.
Analysis becomes more focused as teams use the diagrams to pinpoint bottlenecks and waste. The visual representation helps identify non-value-adding activities and process constraints.
Throughout the Improve phase, modified Activity Network Diagrams showcase proposed changes and their potential impacts. This allows teams to evaluate different improvement scenarios before implementation.
The Control phase utilizes these diagrams to maintain standardized processes and monitor ongoing performance metrics.
Process Improvement Support
Activity Network Diagrams enhance process improvement efforts through several mechanisms. They reveal process inefficiencies by highlighting lengthy paths and unnecessary dependencies. Teams can then restructure workflows to eliminate waste and reduce cycle times.
The diagrams also support resource optimization by showing where teams can reallocate staff or equipment to improve efficiency. This visual tool helps managers identify opportunities for parallel processing and workload balancing.
Quantitative Analysis Applications
Statistical analysis combines with Activity Network Diagrams to provide powerful insights. Teams calculate process capability indices at key nodes, tracking improvement progress through quantitative metrics.
Duration analysis uses three-point estimates to calculate:
- Expected completion times
- Standard deviations
- Probability of meeting deadlines
These calculations help project managers make data-driven decisions about resource allocation and timeline adjustments.
Performance Monitoring And Control
Regular updates to Activity Network Diagrams enable continuous performance monitoring. Teams track actual versus planned progress, identifying variances that require attention.
The diagrams facilitate:
- Progress reporting
- Variance analysis
- Corrective action planning
- Resource utilization tracking
By maintaining updated Activity Network Diagrams, project managers ensure sustained process improvements and achievement of Six Sigma goals.
Master Your Project Management Skills
Transform complex projects into streamlined success

Step-By-Step Creation Of Activity Network Diagram
Creating an effective Activity Network Diagram requires systematic planning and attention to detail.
Modern project management tools streamline this process, enabling teams to develop accurate and useful diagrams for project planning and execution.
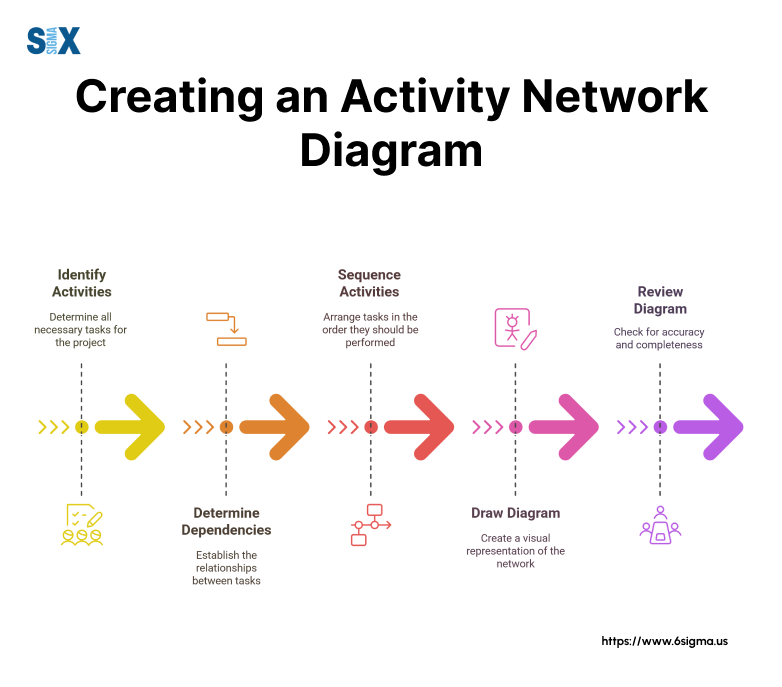
Project Information Gathering
The first step involves collecting essential project details. Project managers must identify all activities, their sequences, and required resources.
This process starts with stakeholder meetings to determine project scope and objectives.
Key information to gather includes:
- Project deliverables and milestones
- Activity durations and dependencies
- Resource requirements
- Technical constraints
- Budget limitations
Mapping Activity Dependencies
Once activities are identified, the next phase focuses on establishing logical relationships between tasks.
Project teams analyze how each activity connects to others, determining predecessor and successor relationships.
Start by arranging activities in chronological order. Then identify which tasks can run parallel and which must follow a strict sequence.
Modern Activity Network Diagram tools offer drag-and-drop interfaces for creating these connections, making the process more intuitive.
Critical Path Calculation Methods
Determining the critical path requires careful analysis of activity durations and float times. Project managers follow these steps:
- Calculate forward pass times, starting from project initiation
- Perform backward pass calculations from project completion
- Identify activities with zero float
- Mark the longest continuous path through zero-float activities
Digital tools automate these calculations, reducing errors and saving time. They also help visualize the critical path through color coding or highlighting.
Time Estimation Techniques
Accurate time estimation forms the foundation of reliable Activity Network Diagrams. Project managers employ several methods:
Historical data analysis uses previous project information to estimate activity durations. Expert judgment draws on experienced team members’ knowledge to determine realistic timeframes.
PERT analysis combines optimistic, most likely, and pessimistic estimates to calculate expected durations. This three-point estimation provides more reliable predictions than single-point estimates.
Digital Tool Implementation
Modern project management software offers specialized features for Activity Network Diagram creation:
- Automated dependency tracking
- Real-time updates
- Collaboration capabilities
- Resource leveling tools
These digital solutions enable teams to maintain dynamic diagrams that evolve with the project, ensuring continued relevance throughout the project lifecycle.
Unlock Your Project Management Potential and Gain hands-on experience in creating Activity Network Diagrams
Comparative Analysis With Alternative Tools
Project managers often evaluate different planning tools to determine the most effective option for their specific needs.
Activity Network Diagrams offer distinct advantages while complementing other project management tools.
PERT Charts And Network Diagrams
PERT charts share many similarities with Activity Network Diagrams, as both focus on task dependencies and sequential relationships.
However, PERT charts emphasize probabilistic time estimates and risk analysis.
The main differences lie in their presentation and focus:
- PERT charts prioritize event milestones
- Activity Network Diagrams emphasize task relationships
- PERT includes more detailed probability calculations
- Network diagrams offer clearer visual task flows
Gantt Chart Comparison
Gantt charts present project timelines in a horizontal bar format, making them ideal for schedule visualization.
While Activity Network Diagrams excel at showing task dependencies, Gantt charts better display:
- Timeline progression across calendar dates
- Resource allocation over time
- Project phases and milestones
- Actual versus planned progress
Many project managers use both tools together, leveraging the strengths of each for complete project oversight.
Workflow Diagram Distinctions
Traditional workflow diagrams focus on process steps and decision points rather than project activities. They typically show operational procedures and business processes through flowchart symbols.
Activity Network Diagrams differ by:
- Focusing on project-specific tasks
- Including duration estimates
- Showing resource requirements
- Identifying critical paths
Unique Advantages Of Network Diagrams
Activity Network Diagrams stand out through several key features. They provide clear visibility of task dependencies, enabling project managers to identify potential bottlenecks early. The critical path calculation helps optimize project schedules and resource allocation.
These diagrams also support:
- Float time identification
- Schedule compression opportunities
- Resource leveling analysis
- Risk assessment capabilities
Integration Capabilities
Modern project management software often combines elements from multiple tools.
Activity Network Diagrams integrate well with other planning tools, creating a more robust project management approach.
Digital platforms enable:
- Automatic updates across different views
- Shared resource pools
- Synchronized scheduling
- Combined reporting features
This integration capability makes Activity Network Diagrams valuable components in comprehensive project management systems.
Lead Projects with Precision and Confidence and learn to identify and eliminate project bottlenecks.
The Future Of Activity Network Diagrams In Six Sigma
Project management tools continue to evolve with technological advancements, and Activity Network Diagrams are no exception.
These changes reshape how teams plan, execute, and monitor projects within Six Sigma frameworks.
Emerging Technologies And Integration
Machine learning algorithms now enhance Activity Network Diagrams by analyzing historical project data to suggest more accurate time estimates and identify potential risks.
These smart systems learn from past projects to predict likely bottlenecks and recommend optimal task sequences.
Real-time collaboration platforms transform static diagrams into dynamic tools. Team members can update progress, adjust dependencies, and modify resource allocations instantly.
These changes sync across all user devices, ensuring everyone works with current information.
Predictive Project Management Capabilities
Advanced analytics integrate with Activity Network Diagrams to forecast project outcomes based on current performance data.
These predictive capabilities help teams identify potential delays before they impact project timelines.
Risk assessment tools evaluate multiple factors simultaneously:
- Resource availability patterns
- Historical performance metrics
- External market conditions
- Team capacity fluctuations
This data-driven approach strengthens decision-making processes and improves project success rates.
Continuous Improvement Innovations
Modern Activity Network Diagrams incorporate feedback loops that capture process improvements and lessons learned.
These insights automatically update best practices and refine future project planning efforts.
Automated monitoring systems track key performance indicators throughout the project lifecycle. When variations occur, the system alerts project managers and suggests potential corrective actions based on Six Sigma principles.
Integration With Industry 4.0
Internet of Things sensors feed live data into Activity Network Diagrams, providing automatic updates on task completion and resource utilization.
This integration reduces manual reporting requirements and improves accuracy.
Cloud-based platforms enable:
- Global team collaboration
- Real-time performance tracking
- Automated resource optimization
- Instant scenario analysis
These technological advances position Activity Network Diagrams as increasingly valuable tools for modern project management and Six Sigma implementation.
SixSigma.us offers both Live Virtual classes as well as Online Self-Paced training. Most option includes access to the same great Master Black Belt instructors that teach our World Class in-person sessions. Sign-up today!
Virtual Classroom Training Programs Self-Paced Online Training Programs


