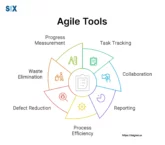
fbpx

Articles

Image: Change Impact Analysis

Change Impact Analysis: A Guide for Successful Transformations

Change impact analysis cultivates communities navigating progression’s consequences insightfully. With prudent study, enterprises choose understanding-guided, shielded yet resource-optimizing journeys – cultivating welcoming advancement spirits. Structured evaluation illuminates scope, magnitude, and implications upon peoples, coordination, technologies, and culture wherever complexity interconnects. Key Highlights What Is Change Impact Analysis? Progress navigation proves ever-paramount as environments evolve endlessly. […]

View More

Image: p chart vs np chart

P-chart vs Np-chart in Lean Six Sigma. All You Need to Know

Quality monitoring relies partly on attribute charts like P chart and NP chart. P charts gauge proportions defective when test bunch sizes stay steady. NP charts instead track non-compliant units directly when batch quantities fluctuate. Both adhere to the binomial distribution modeling independent trialsā€™ success/failure probabilitiesā€”the essential attributes a binary nature. P chart and NP […]

View More

Image: Multivariate SPC

Multivariate SPC: Advanced Process Monitoring & Control Techniques

Quality observation methods sometimes fall short addressing intricate links and interdependencies between numerous workflow aspects. Multivariate SPC addresses this. Multivariate monitoring addresses intricate data realities, correlations, and nonlinear motions, cultivating deeper comprehension and management within complex manufacturing environments. Key Highlights Understanding Multivariate Quality Observation Multivariate Statistical Process Control (MSPC) refers to a set of advanced […]

View More

Image: np-chart

Lean Six Sigma Methodology. What is Np-chart?

Quality monitoring and workflow refinement are important for any business to consistently fulfill client demands. Statistical process control approaches prove helpful statistical tools here. One effective gizmo specifically applicable to quality metrics involves the np chart. Short for “nonconforming units”, np charts track defective quantities amid test samples/batches. Employed where characteristics measure binary (compliant/noncompliant), np […]

View More

Image: Hazard and Operability Study (HAZOP)

Hazard and Operability Study (HAZOP): A Guide for Risk Assessment

Hazard and Operability study/assessment emerges as a principled partner for risk surveying – especially within material/workflow-sensitive arenas. Hazard and Operability Study (HAZOP) describes a systematic yet adaptable approach pinpointing feasible challenges and difficulties, involving finer parts examination called “nodes”. Key Highlights What defines Hazard and Operability Study? (HAZOP) Hazard and Operability Study (HAZOP) offers a […]

View More

Maximize Productivity and Improve Value Delivery with Kanban Planning

Managing projects well is key to success today. Traditional methods struggle to keep up with changing needs and markets. Kanban planning from lean ideas emerged as a smart solution. Kanban focuses on visualizing the whole workflow, limiting simultaneous efforts, and measuring times. This optimizes how teams work. Central to Kanban is the Kanban board visually […]

View More

Image: Six Sigma in HR

Six Sigma in HR: Transforming Processes for Operational Excellence

Six Sigma in HR circles progress through refinement, leveraging evidence and statistics to expose flaws, refine coordination and strengthen service excellence overall. Six Sigma historically rooted in manufacturing and engineering, yet its principles and methods stretch broadly – including human coordination stewardship. Key Highlights What defines Six Sigma Progress? Six Sigma describes an understanding-led, principled […]

View More

Image: Value Stream Management Tools

Top Value Stream Management Tools in 2025

Businesses always need tech that meets client needs better, and faster at less expense. So they widely use agile and DevOps techniques built for cooperation, automation, and constant betterment. Yet as programs grow complex, tracking software provision’s full journey remains a hurdle. A brilliant aid arrives as a Value Stream Management (VSM) solution. These tools […]

View More

Image: A circular diagram depicting the Continuous Process Improvement (CPI) Cycle

Continuous Process Improvement (CPI): A Guide for Businesses

Continuous process improvement (CPI) describes identifying, outlining, implementing, measuring, and analyzing effectiveness shifts within an organization’s workflows. Surpassing the notion that “unbroken works best”, this recognizes that even flowing operations can benefit from refinement and optimization. Key Highlights What is Continuous Process Improvement? Continuous process improvement (CPI) is the cornerstone of operational excellence and long-term […]

View More

Image: Value Stream Management

Value Stream Management in Lean Six Sigma. A Definitive Guide

Value stream management (VSM) surfaces a solutionā€”optimizing end-to-end value delivery. It grants panoramic vision across the whole workflow, enabling obstacle-spotting and scrubbing sluggishness hindering value-furnishing’s flow. Value Stream Management (VSM) charts a course staying outfitted for reactivity amid technological, and commercial fluidity through data-driven decision-making, and continuous upgrades. Key Highlights What is Value Stream Management? […]

View More

Image: SCAMPER Technique

SCAMPER Technique: Drive Innovation & Creativity

SCAMPER presents a principled creativity approach. It encourages out-of-box exploration and perspective flexibility to nourish insight. For progress-seekers committed to cooperation and solutions uplifted through understanding as one, SCAMPER emerges as a trusted companion. Key Highlights What is the SCAMPER Technique? The SCAMPER technique is a powerful creative problem-solving and brainstorming method that organizations across […]

View More

Image: Corrective and Preventive Action (CAPA)

Corrective Action and Preventive Action (CAPA). The Only Guide You Need

Quality, compliance, and continuous improvement are key for consistent growth and survivability for organizations irrespective of industry. The corrective and preventive action (CAPA) is a structured approach that enables organizations to identify, analyze, and address nonconformities, deviations, and potential risks. A critical aspect of achieving these goals is implementing an action plan that powers operational […]

View More

Image: SPC Charts

SPC Charts: The Ultimate Guide to Statistical Process Control & Quality

Introduced by Walter Shewhart’s pioneering work and then enhanced through W. Edwards Deming, SPC charts offer visual representations showcasing workflow shifts. Organizations pursue steady excellence, leading to widespread Statistical Process Control adoption – a potent tool for observation, analysis, and progression. By graphing data against calculated boundaries, charts discern natural flux from source-worthy deviations. SPC […]

View More

Image: Continuous Improvement Model

Process Improvement Methodologies. What is the Continuous Improvement Model

Keeping up with the changing market dynamics and customer needs is key to survival. This calls for a continuous improvement model in business processes, products/services, etc. to gain and maintain an edge over competitors. The continuous improvement model is a systematic approach to identifying and implementing incremental changes to drive efficiency, reduce waste, improve quality, […]

View More

Image: Quality Risk Management (QRM)

Quality Risk Management (QRM): A Comprehensive Guide for Excellence

Proactively detecting, gauging, and lessening risks endangering quality, safety, and obedience is crucial for organizations. Quality risk management presents a systematic, risk-focused framework structuring evaluations and controls for manufacturing, design, and business undertakings linked concerns. QRM bases itself on scientifically-led, customer-protecting assessment logic steered in careful balance with formalized efforts matching identified priorities. This evidence-guided […]

View More

Image: Residual Analysis

Everything to Know About Residual Analysis

Regression analysis proves a potent statistical technique relating outcome variables to one or more influence variables. However, models heavily rely on sound foundations and quality information. Here residual examination plays an essential role in assumptions evaluation and fit adequacy assessment. Residuals describe gaps between observed outcome values and those predicted. Containing valuable clues about performance, […]

View More

Six Sigma Green Belt vs Black Belt. Levels, Roles, and More

Businesses look for ways to make things better – processes that run more smoothly, fewer mistakes, and happier customers. Six Sigma is a great tool for improvement. It helps companies get better at fixing problems and preventing issues. In Six Sigma certification, there exist two key levels: Lean Six Sigma Green Belt and Lean Six […]

View More

Image: Kanban and Scrum

Agile Project Management – Kanban vs Scrum. All You Need to Know

Amid software evolution and project direction’s quickening waters, agility rises for improvisational acuity, cross-discipline kinship, and swift value delivery. Conspicuous stand Scrum and Kanban, diverse yet charting productivity’s upswell. Kanban, meaning “visual communication” in Japanese, emphasizes workflow portrayal, simultaneous efforts constraints, and perpetual optimization across endless refinement currents. Contrarily, Scrum revolves around sprints, multidisciplinary ensembles, […]

View More

Image: Kanban Cards

Kanban Cards: Visualize Workflow, Boost Productivity & Drive Improvement

Where agility and efficiency matter most, visualizing workflows proves pivotal. Enter Kanban cards – a simple yet potent approach revolutionizing how cross-sector teams approach their work. Fundamentally, each card tangibly represents tasks requiring completion. Displayed on Kanban boards compartmentalized by workflow stages, the card’s fluid movement across columns permits easy tracking, bottleneck finding, handoff streamlining, […]

View More

Image: DMAIC Tools

Six Sigma Tools and Techniques – DMAIC Tools. The Only Guide You Need

DMAIC (Define, Measure, Analyze, Improve, Control) methodology is a core component of Six Sigma and Lean Six Sigma that provides a structured and data-driven approach to process improvement. It consists of various techniques and tools tailored for each phase. DMAIC tools are designed to identify defects, gather data, analyze root causes, implement solutions, and establish […]

View More