The Benefits of Using Swimlane Diagrams in Business Processes
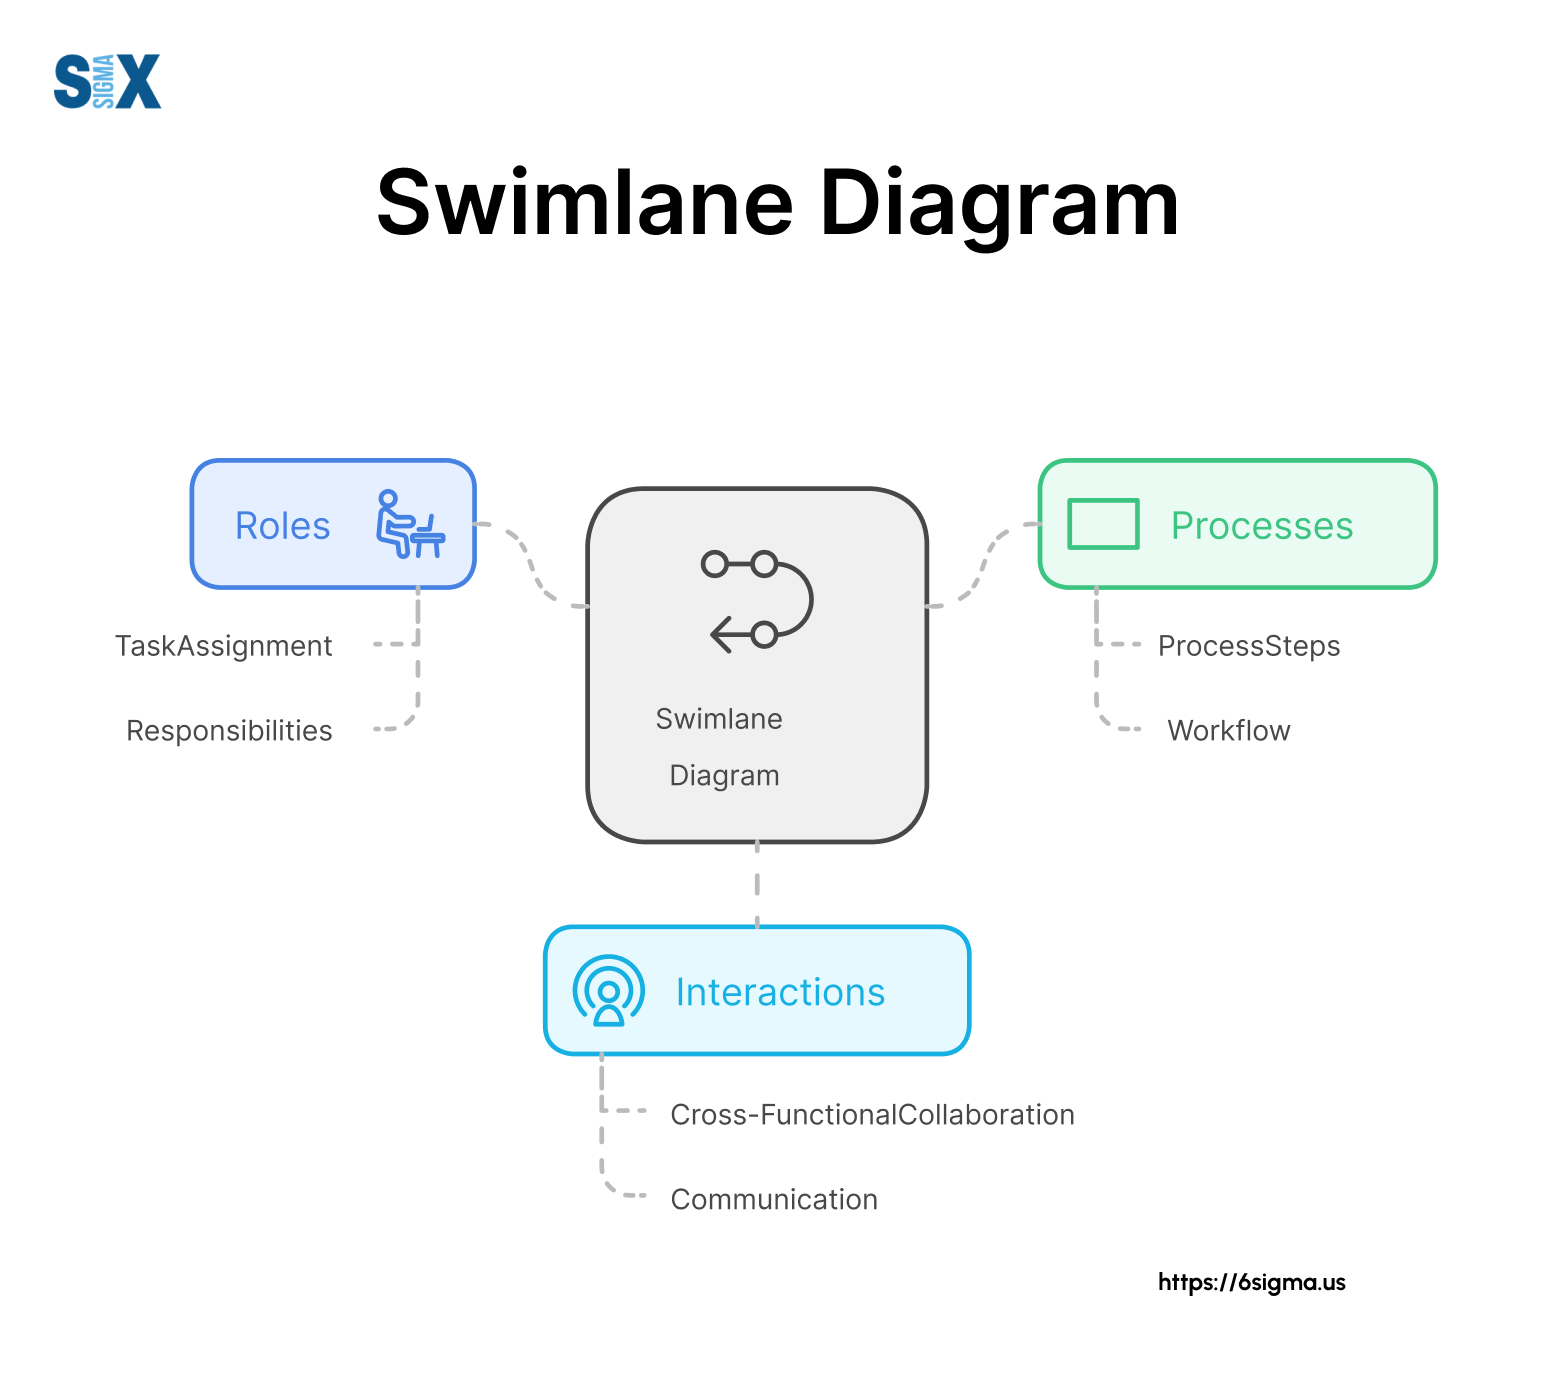
A swimlane diagram, also known as a cross-functional flowchart, is a versatile process mapping tool that delineates responsibilities and workflows across different departments or individuals within an organization.
By visually representing the flow of tasks and decision points, swimlane diagrams offer a clear, comprehensive view of complex processes, making them an essential component in the toolkit of any process improvement specialist or project manager.
Swimlane diagrams complement Lean fundamentals, such as value stream mapping, by clarifying role-specific responsibilities.
Key Highlights
- Defining swimlane diagrams and their unique features
- Essential components: lanes, symbols, and flow representation
- Step-by-step guide to creating effective swimlane diagrams
- Applications in business process mapping and project management
- Tools and technologies for swimlane diagramming
- Advanced techniques for process optimization.
What are Swimlane Diagrams?
A swimlane diagram, also known as a cross-functional flowchart or a Rummler-Brache diagram, is a visual representation of a process that delineates responsibilities and workflows across different functional areas or individuals within an organization.
The term “swimlane” is derived from the diagram’s resemblance to lanes in a swimming pool.
Each lane represents a specific department, team, or individual involved in the process.
This structure allows for a clear depiction of how tasks flow between different functional areas, making it easier to identify handoffs, bottlenecks, and areas for improvement.
Swimlane diagrams are particularly valuable for professionals pursuing Six Sigma certification, as they align with the methodology’s focus on process clarity and waste reduction.
Swimlane Diagram vs. Traditional Flowchart
While both swimlane diagrams and traditional flowcharts are used for process mapping, there are significant differences between the two.
Traditional flowcharts primarily focus on the sequence of steps in a process, whereas swimlane diagrams add an extra dimension by clearly showing who is responsible for each step.
In my experience working with companies like 3M and Dell, I’ve observed that swimlane diagrams offer several advantages over traditional flowcharts:
- Clarity of responsibility: Swimlane diagrams clearly show which department or individual is responsible for each task.
- Improved communication: They highlight interactions between different functional areas, promoting better cross-functional collaboration.
- Easier identification of inefficiencies: By visualizing the process across different departments, it’s easier to spot redundancies or unnecessary handoffs.
- Enhanced process analysis: Swimlane diagrams provide a more comprehensive view of the process, allowing for more effective analysis and optimization.
Take a look at Swimlane Diagram concepts with Lean Six Sigma Yellow Belt
Key Components of a Swimlane Diagram
Discover the essential elements that make up a swimlane diagram.
Swim Lanes and Functional Bands
The core component of a swimlane diagram is, unsurprisingly, the swimlanes themselves.
These horizontal or vertical bands represent different functional areas, departments, or individuals involved in the process.
Each lane contains the activities and tasks that fall under the responsibility of that particular entity.
In my work developing Six Sigma deployment strategies, I’ve found that clearly defined swimlanes are crucial for effective process mapping.
They not only show who does what but also highlight the interactions and handoffs between different functional areas.
Process Flowchart Symbols
Swimlane diagrams incorporate standard flowchart symbols to represent different elements of the process.
Some of the most common symbols include:
- Rectangles: Represent activities or tasks
- Diamonds: Indicate decision points
- Arrows: Show the flow of the process
- Circles: Represent the start or end of a process
- Parallelograms: Indicate inputs or outputs
Using these standardized symbols ensures that the diagram is easily understood by all stakeholders, regardless of their familiarity with the specific process being mapped.
Horizontal vs. Vertical Swimlanes
Swimlane diagrams can be oriented either horizontally or vertically.
The choice between the two often depends on personal preference or the specific requirements of the process being mapped.
Horizontal swimlanes are more common and are typically easier to read, especially for processes that involve many steps or have a clear left-to-right flow.
Vertical swimlanes, on the other hand, can be useful for processes with fewer steps or when you want to emphasize the hierarchy of the involved departments.
In my experience leading international projects, I’ve found that the choice between horizontal and vertical swimlanes can sometimes be influenced by cultural factors.
For instance, in countries where text is read from right to left, vertical swimlanes might be preferred.
Creating an Effective Swimlane Diagram
Master the step-by-step process of building a clear and informative swimlane diagram.
Steps to Build a Swimlane Diagram
Creating an effective swimlane diagram involves several key steps:
- Identify the process: Clearly define the process you want to map, including its start and end points.
- Determine the swimlanes: Identify all departments, teams, or individuals involved in the process.
- List the activities: Document all the tasks and activities that occur within the process.
- Assign activities to swimlanes: Place each activity in the appropriate swimlane based on who is responsible for it.
- Connect the activities: Use arrows to show the flow of the process from one activity to another.
- Add decision points: Include diamond shapes to represent points where the process can take different paths based on certain conditions.
- Review and refine: Go through the diagram with stakeholders to ensure accuracy and completeness.
Best Practices for Swimlane Diagram Design
Through my years of experience in process improvement, I’ve developed several best practices for creating effective swimlane diagrams:
- Keep it simple: Don’t overcrowd the diagram with too much detail. Focus on the key steps and decision points.
- Use consistent formatting: Maintain consistency in the size and style of shapes and text throughout the diagram.
- Clearly label everything: Ensure all swimlanes, activities, and decision points are clearly labeled.
- Show handoffs: Highlight where responsibilities transfer from one swimlane to another.
- Include a legend: Provide a key explaining any symbols or color-coding used in the diagram.
- Consider using software: Utilize specialized diagramming tools to create professional-looking and easily editable swimlane diagrams.
- Involve stakeholders: Engage with the people who actually perform the process to ensure accuracy and buy-in.
Get detailed explanation on how to create Swimlane Diagram with Lean Six Sigma Green Belt
Applications of Swimlane Diagrams
Uncover the versatile uses of swimlane diagrams in business process improvement and project management.
Business Process Mapping and Improvement
They provide a clear visual representation of complex processes, making it easier to identify inefficiencies, redundancies, and opportunities for optimization.
For instance, when I worked with Motorola to improve their manufacturing processes, we used swimlane diagrams to map out the entire production line. This approach is central to Six Sigma Green Belt certification, which trains professionals to systematically analyze and refine workflows
This allowed us to identify several unnecessary handoffs between departments, which we were able to eliminate, resulting in a 20% reduction in production time.
Swimlane diagrams are particularly useful for:
- Identifying bottlenecks and delays
- Spotting redundant or unnecessary steps
- Clarifying roles and responsibilities
- Improving communication between departments
- Standardizing processes across an organization
Project Management and Workflow Optimization
Beyond process improvement, swimlane diagrams are also powerful tools for project management and workflow optimization.
They provide a clear visual representation of how tasks flow between different team members or departments, making it easier to manage complex projects.
In my experience leading international projects, I’ve used swimlane diagrams to:
- Plan project workflows
- Assign responsibilities to team members
- Identify potential resource conflicts
- Optimize task sequencing
- Improve project communication
For example, when working on a global product launch for HP, we used a swimlane diagram to map out the entire launch process, from initial concept to market release.
This helped us coordinate activities across multiple departments and international offices, ensuring a smooth and successful launch.
Learn what are the practical use cases of the Swimlane Diagrams and how they are beneficial for your business with Lean Six Sigma Black Belt
Tools and Technologies for Swimlane Diagramming
Explore the latest software solutions that streamline the creation of swimlane diagrams.
Popular Swimlane Diagram Software
While it’s possible to create swimlane diagrams using general-purpose diagramming tools or even pen and paper, specialized software can greatly streamline the process and produce more professional results.
Some popular options include:
- Microsoft Visio: A comprehensive diagramming tool that offers robust swimlane diagram capabilities.
- Lucidchart: A web-based diagramming application that’s known for its user-friendly interface and collaboration features.
- Draw.io: A free, open-source diagramming tool that supports swimlane diagrams and integrates well with Google Drive and other platforms.
- SmartDraw: Another web-based tool that offers a wide range of templates and shapes for creating swimlane diagrams.
- Creately: A diagramming tool that offers both online and desktop versions, with strong support for swimlane diagrams and other process mapping techniques.
In my consulting work, I often recommend that organizations choose a tool that aligns with their existing technology stack and collaboration needs.
For instance, if a company heavily uses Microsoft products, Visio might be the most seamless choice.
BPMN and UML in Swimlane Diagrams
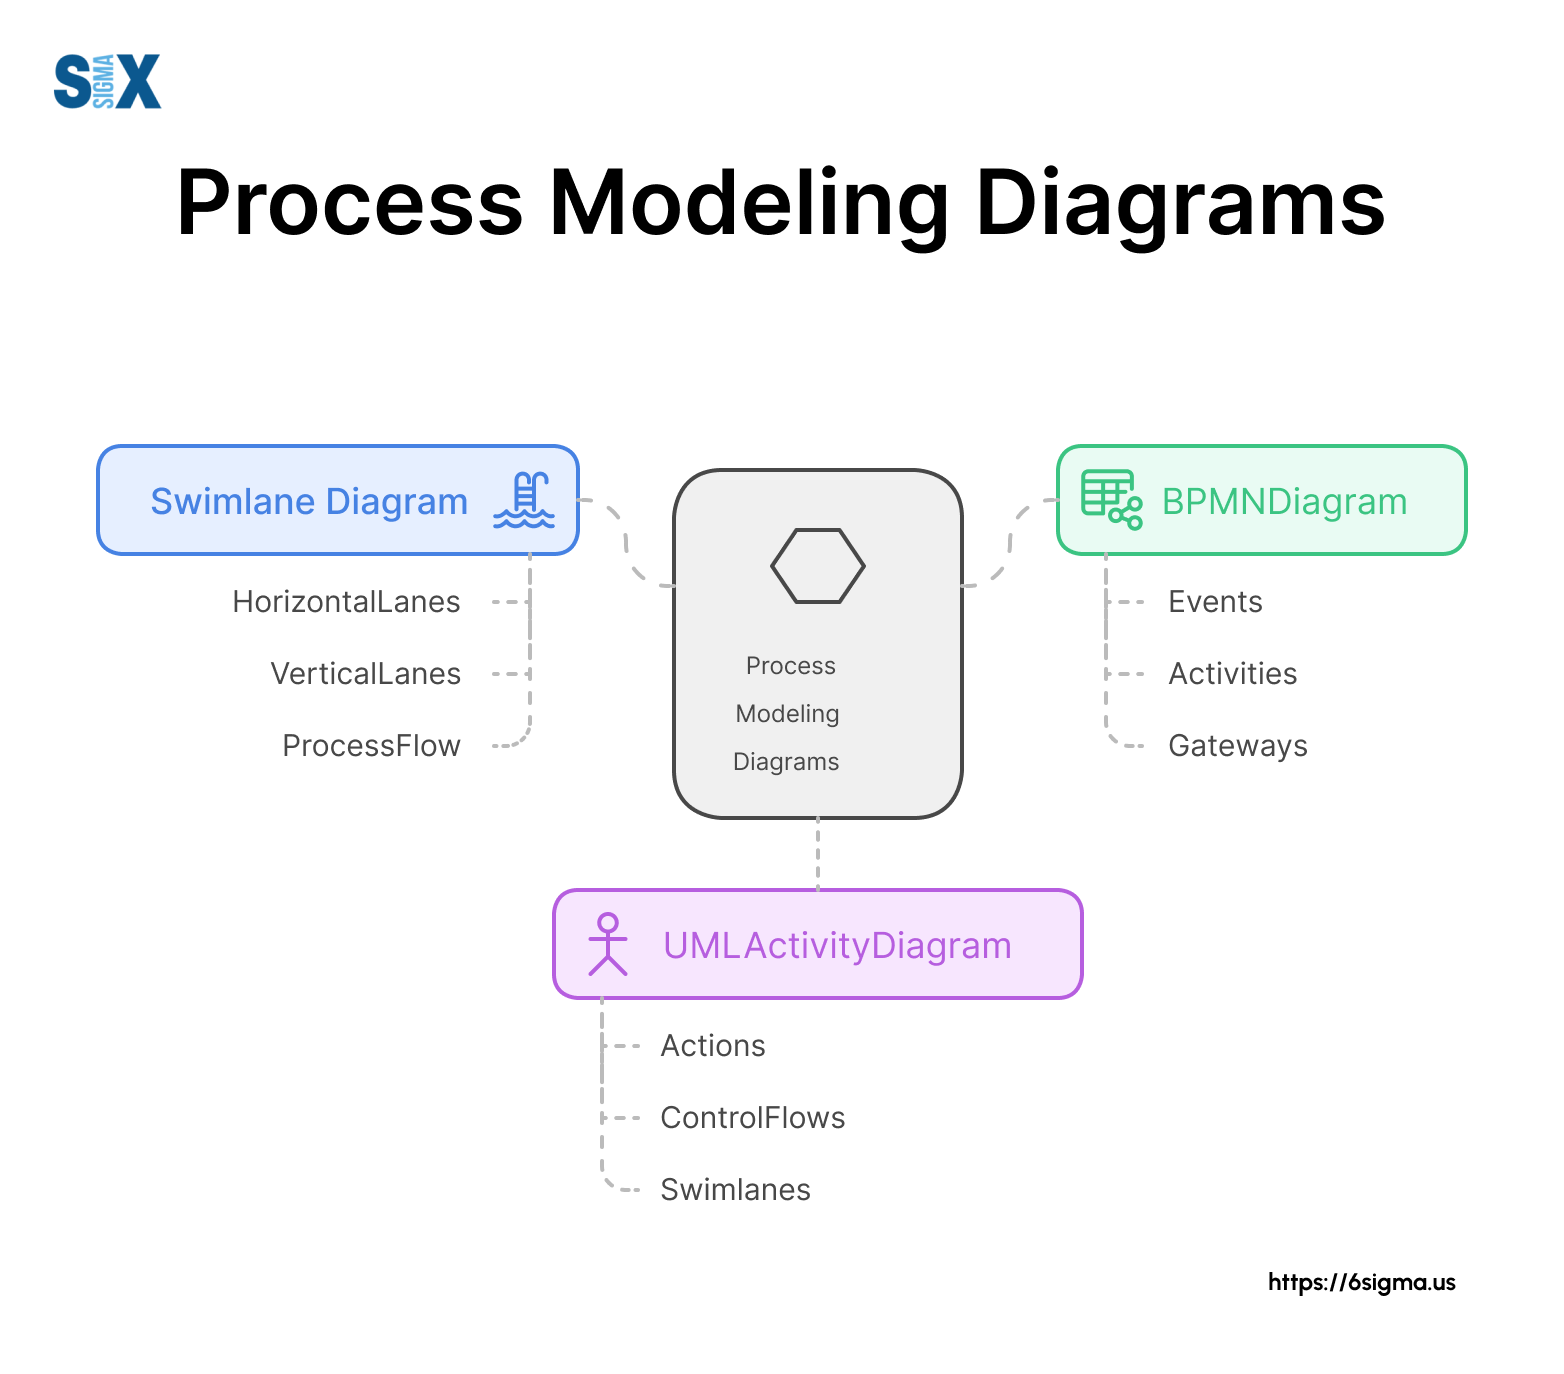
For more complex process modeling, particularly in IT and software development contexts, two important standards come into play: Business Process Model and Notation (BPMN) and Unified Modeling Language (UML).
BPMN is a standardized graphical notation for drawing business processes in a workflow.
It incorporates swimlanes as a key element and provides a rich set of symbols for representing various process elements.
BPMN is particularly useful for mapping processes that involve multiple organizations or complex interactions between different parts of an organization.
UML, on the other hand, is a general-purpose modeling language used in software engineering.
While not specifically designed for business process mapping, UML includes activity diagrams that can incorporate swimlanes to show how different objects or actors interact in a process.
In my work with technology companies like Intel and Xerox, I’ve found that using BPMN or UML can enhance the precision and standardization of swimlane diagrams, especially when dealing with complex, software-intensive processes.
Advanced Swimlane Diagram Techniques
Delve into sophisticated methods for representing decision points and conditional flows in your diagrams.
Incorporating Decision Points and Conditional Flows
As processes become more complex, it’s crucial to effectively represent decision points and conditional flows in swimlane diagrams.
Decision points, typically represented by diamond shapes, show where the process can take different paths based on certain conditions.
In my experience leading Six Sigma projects, I’ve found that clearly mapping out these decision points can significantly improve process understanding and optimization.
For instance, when working with Seagate on improving their quality control process, we used swimlane diagrams with multiple decision points to map out the various inspection and testing stages.
This allowed us to identify redundant tests and streamline the process, reducing overall inspection time by 30%.
To effectively incorporate decision points:
- Clearly label each decision point with the question being asked.
- Show all possible outcomes from the decision point.
- Ensure that each outcome leads to a clear next step in the process.
- Consider using different colors or line styles to distinguish between primary and alternative process flows.
Identifying and Resolving Process Bottlenecks
One of the most valuable applications of swimlane diagrams is in identifying and resolving process bottlenecks.
Bottlenecks are points in the process where work or information flow is constrained, leading to delays and inefficiencies.
To identify bottlenecks in a swimlane diagram:
- Look for steps where work tends to accumulate or where there are frequent delays.
- Identify any steps that have significantly longer processing times than others.
- Pay attention to handoffs between swimlanes, as these are common sources of bottlenecks.
- Look for decision points that frequently lead to rework or delays.
Once bottlenecks are identified, you can use the swimlane diagram to visualize potential solutions.
This might involve redistributing work between swimlanes, adding resources to constrained areas, or redesigning parts of the process to eliminate unnecessary steps or decision points.
For example, when I worked with GE on improving their customer service process, we used swimlane diagrams to identify a bottleneck in the escalation process.
Combining swimlane diagrams with root cause analysis training ensures teams address systemic issues rather than symptoms
By visualizing the flow of customer issues across different departments, we were able to redesign the escalation criteria and reduce average resolution time.
The Power of Swimlane Diagrams
Swimlane diagram(s) are one of the most powerful tools.
Let’s recap some of the key benefits:
- Clarity of responsibilities: Swimlane diagrams clearly delineate who is responsible for each step in a process, reducing confusion and improving accountability.
- Improved cross-functional communication: By visualizing how work flows between different departments or individuals, swimlane diagrams facilitate better communication and collaboration across an organization.
- Efficient process analysis: These diagrams make it easier to identify redundancies, bottlenecks, and inefficiencies in complex processes.
- Enhanced project management: Swimlane diagrams provide a clear visual representation of project workflows, making it easier to manage resources and timelines.
- Standardization of processes: By creating a visual standard for how processes should flow, swimlane diagrams help ensure consistency across an organization.
- Easier optimization: The visual nature of swimlane diagrams makes it simpler to identify and implement process improvements.
- Versatility: From manufacturing to software development, swimlane diagrams can be applied across a wide range of industries and processes.
As we look to the future, I anticipate several exciting developments in the world of swimlane diagramming:
In conclusion, swimlane diagrams have proven to be an invaluable tool for process improvement, project management, and organizational efficiency.
As someone who has applied these diagrams in numerous real-world scenarios across various industries, I can attest to their power in clarifying complex processes and driving meaningful improvements.
As we move into an increasingly digital and data-driven future, the role of visual process mapping tools like swimlane diagrams will only become more critical.
By mastering these tools now, you’ll be well-positioned to drive efficiency and innovation in your organization for years to come.
SixSigma.us offers both Live Virtual classes as well as Online Self-Paced training. Most option includes access to the same great Master Black Belt instructors that teach our World Class in-person sessions. Sign-up today!
Virtual Classroom Training Programs Self-Paced Online Training Programs


