  Statistical Design of Experiments
Unit VII
Unit VII
Robust Design
Robust Design
using
using
Taguchi Methods
Taguchi Methods
|
   Statistical Design of Experiments
Robust Design
Robust Design
|
  Statistical Design of Experiments
Robust Design
Robust Design
•
•
An engineering strategy for product/
An engineering strategy for product/
process designs
process designs
•
•
Can be applied from the start of R&D
Can be applied from the start of R&D
and Advanced Product/Process
and Advanced Product/Process
Design
Design
•
•
An efficient approach to generate
An efficient approach to generate
technical information
technical information
|
  Statistical Design of Experiments
Robust Design
Robust Design
•
•
Concentrates on
Concentrates on
»
»
Identifying ideal function(s) for
Identifying ideal function(s) for
product/process design
product/process design
»
»
Choosing the best levels for
Choosing the best levels for
product/process design parameters
product/process design parameters
that optimize performance, while
that optimize performance, while
minimizing sensitivity to variation
minimizing sensitivity to variation
(robustness), at lowest cost
(robustness), at lowest cost
|
   Statistical Design of Experiments
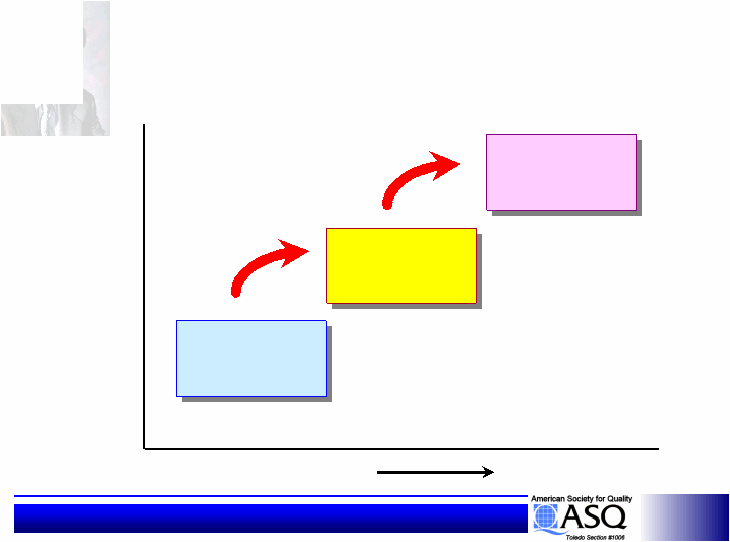
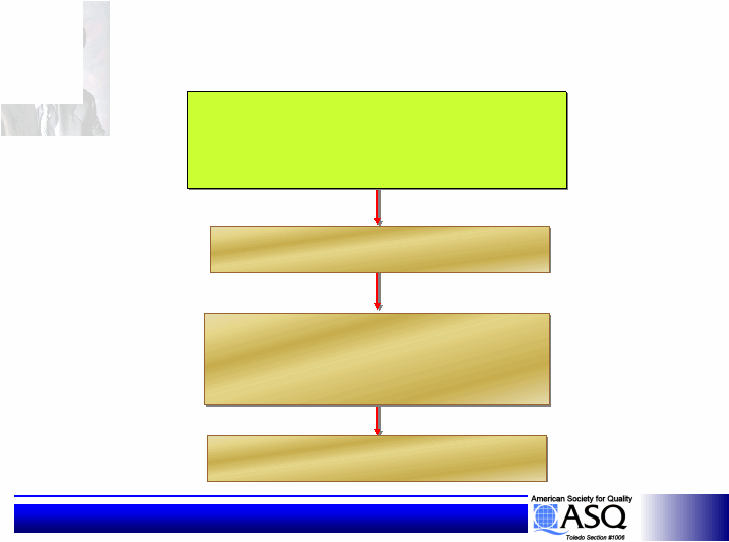
Design Phases
Design Phases
SYSTEM
DESIGN
PARAMETER
DESIGN
TOLERANCE
DESIGN
TIME
DESIGN
STABILITY
Low
High
Primary
Primary
Focus of
Focus of
Robust Design
Robust Design
|
  Statistical Design of Experiments
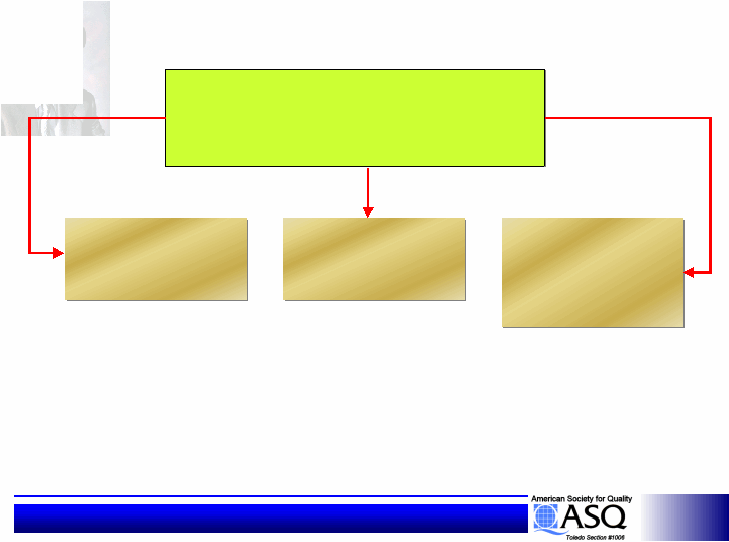
Design Phases
Design Phases
•
•
System Design
System Design
Generating and Selecting concepts.
Generating and Selecting concepts.
Concept comparisons
Concept comparisons
Functional design focused on the
Functional design focused on the
pertinent Technology
pertinent Technology
No DOE occurs at this stage
No DOE occurs at this stage
•
•
System Design
System Design
•
•
Parameter Design
Parameter Design
–
–
A means of Both reducing costs and
A means of Both reducing costs and
improving quality by making effective use of
improving quality by making effective use of
experimental design methods
experimental design methods
–
–
Selecting values for design parameters
Selecting values for design parameters
which cause the system performance to be
which cause the system performance to be
insensitive to variations (or noise factors)
insensitive to variations (or noise factors)
–
–
This is the heart of Robust Design
This is the heart of Robust Design
•
•
System Design
System Design
•
•
Parameter Design
Parameter Design
•
•
Tolerance Design
Tolerance Design
–
–
Economic evaluation of tolerances
Economic evaluation of tolerances
–
–
Identifying those to tighten and those to relax
Identifying those to tighten and those to relax
–
–
After the system has been designed and the
After the system has been designed and the
nominal mid-values of its parameters
nominal mid-values of its parameters
determined, the next step is to determine the
determined, the next step is to determine the
tolerances of the parameters
tolerances of the parameters
|
  Statistical Design of Experiments
Why Robust Design?
Why Robust Design?
•
Warranty Costs
-
Costs exceed target goals
-
Products sometimes fail to perform
-
Variation in product
function
is also a major
contributor (lack of robustness)
-
any variation from the performance target
is bad for the customer
•
•
Warranty Costs...
Warranty Costs...
•
•
Product Cycle Time...
Product Cycle Time...
–
–
Need to reduce “design/development time”
Need to reduce “design/development time”
–
–
Need to improve new product reliability...
Need to improve new product reliability...
it’s never where it should be at ‘launch.’
it’s never where it should be at ‘launch.’
–
–
Design ‘refining’ is avoided when the
Design ‘refining’ is avoided when the
robustness
robustness
(sensitivity to variation) is
(sensitivity to variation) is
evaluated and known early
evaluated and known early
|
  Statistical Design of Experiments
Robust Design is...
Robust Design is...
•
•
90% Engineering Strategy
90% Engineering Strategy
•
•
10% D.O.E. (Testing)
10% D.O.E. (Testing)
|
  Statistical Design of Experiments
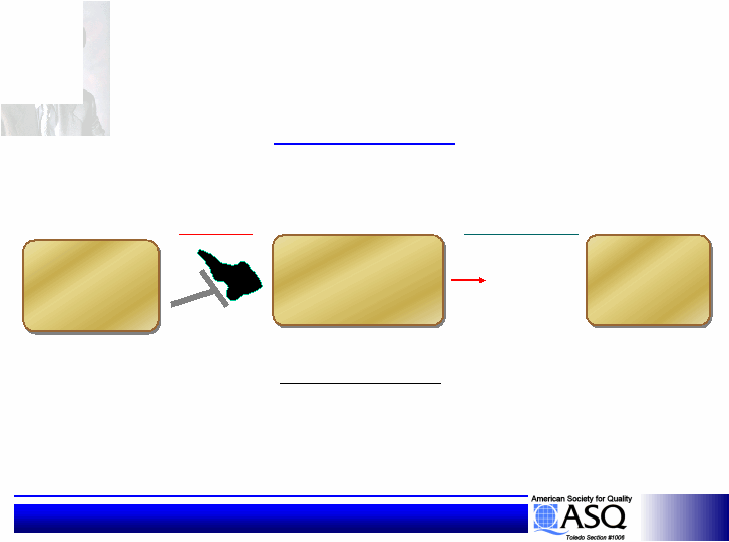
Customer View -
Customer View -
Engineering View
Engineering View
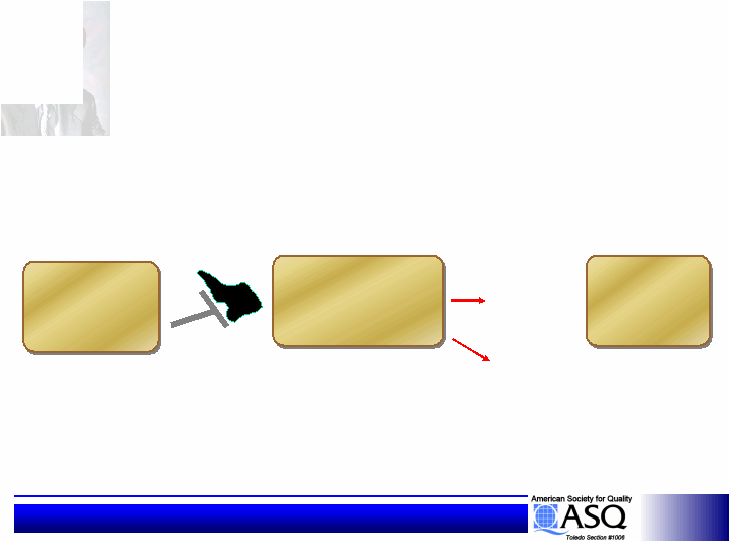
Control factors
Control factors
System
(Subsystem)
System
System
(Subsystem)
(Subsystem)
Engineered System
Input
Input
Signal
Signal
Customer
Intent
Customer
Intent
Perceived
Result
Perceived
Result
Noise Factors
Noise Factors
Output
Output
Response
Response
|
  Statistical Design of Experiments
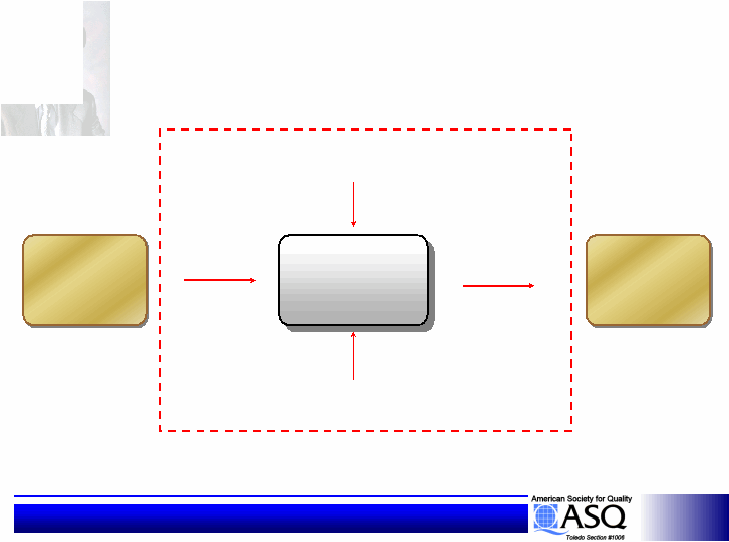
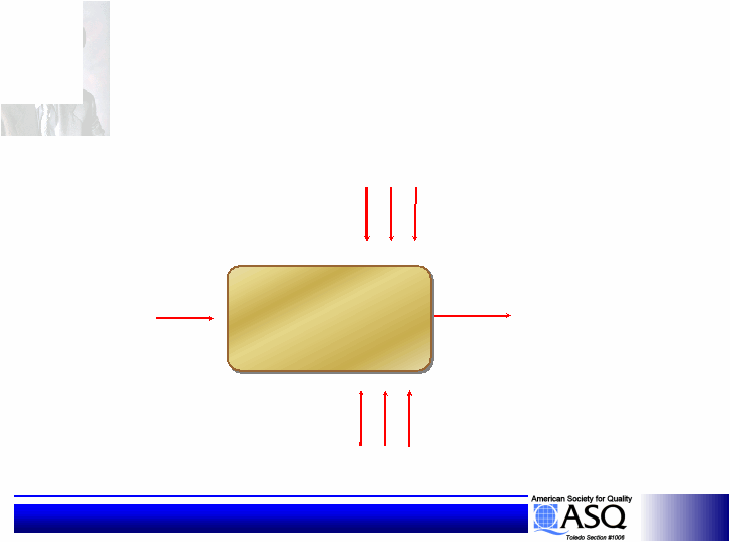
Parameter Diagram
Parameter Diagram
SYSTEM
SYSTEM
INPUT
INPUT
SIGNAL
SIGNAL
OUTPUT
OUTPUT
RESPONSE
RESPONSE
CONTROL
CONTROL
FACTORS
FACTORS
NOISE
NOISE
FACTORS
FACTORS
A Framework for Describing the Engineered System
|
  Statistical Design of Experiments
Control Factors
Control Factors
•
•
Design parameters of a system that:
Design parameters of a system that:
•
•
affect system performance, and
affect system performance, and
•
•
are specified by nominal values
are specified by nominal values
•
•
Examples include:
Examples include:
•
•
material (chemical makeup, hardness)
material (chemical makeup, hardness)
•
•
mechanical (pressures, flow rates)
mechanical (pressures, flow rates)
•
•
dimensional (length, width, roundness,
dimensional (length, width, roundness,
coating thickness)
coating thickness)
•
•
surface finish (smoothness)
surface finish (smoothness)
|
  Statistical Design of Experiments
Noise Factors
Noise Factors
•
•
Variables or parameters which:
Variables or parameters which:
•
•
affect system performance, and
affect system performance, and
•
•
are either uncontrollable or not
are either uncontrollable or not
economical to control
economical to control
•
•
Examples include:
Examples include:
•
•
material variation (chemical makeup,
material variation (chemical makeup,
strength)
strength)
•
•
environment (temperature, humidity)
environment (temperature, humidity)
•
•
Customer Application
Customer Application
|
  Statistical Design of Experiments
3 Types of Noise
3 Types of Noise
•
•
Customer usage
Customer usage
(External)
(External)
•
•
Maintenance practices
Maintenance practices
•
•
Geographic features
Geographic features
•
•
Duty cycle
Duty cycleTolerances
•Manufacturing
•Manufacturing
•Component Wear
•Component Wear
Processes
Processes
•Corrosion / Chemical
•Corrosion / Chemical
Equipment
Equipment
•
•
Material / Part
Material / Part
Tolerances
•Aging (Internal)
•Aging (Internal)
•
•
•
•
Degradation
Degradation
•
•
Calibration Drift
Calibration Drift
|
  Statistical Design of Experiments
Noise factors are Important!
Noise factors are Important!
Loss to Society
Loss to Society
Loss to Society
Deviations of
System Performance
from Target Value
Deviations of
Deviations of
System Performance
System Performance
from Target Value
from Target Value
Noise Factors
Cause Variations
Noise Factors
Noise Factors
Cause Variations
Cause Variations
Product/Process Design
Product/Process Design
Product/Process Design
|
    Statistical Design of Experiments
Noise Factors
Cause Variations
Noise Factors
Noise Factors
Cause Variations
Cause Variations
Outer
Outer
Noise
Noise
Variations in
Variations in
Operating
Operating
environment
environment
Human Error
Human Error
Manufacturer
Manufacturer
has least
has least
control
control
Inner
Inner
Noise
Noise
Between
Between
Product
Product
Noise
Noise
Deterioration
Deterioration
Material
Material
Wearout
Wearout
Manufacturing
Manufacturing
Imperfections
Imperfections
Unit to Unit
Unit to Unit
Process
Process
Gage R & R
Gage R & R
|
  Statistical Design of Experiments
Countermeasures for Noise
Countermeasures for Noise
•
•
Ignore Them...
Ignore Them...
-
-
Could result in fire fighting later on.
Could result in fire fighting later on.
•
•
Control or Eliminate Them...
Control or Eliminate Them...
-
-
Standardization
Standardization
-
-
Failsafing
Failsafing
-
-
Eliminating the cause may be expensive.
Eliminating the cause may be expensive.
--
-
Noise factor becomes a control factor.
Noise factor becomes a control factor.
•
•
Compensate for Effects of
Compensate for Effects of
Noise...
Noise...
-
-
Feedback controls in manufacturing
Feedback controls in manufacturing
or the product.
or the product.
-
-
Adds complexity.
Adds complexity.
-
-
Noise factor becomes a signal.The focus of Robust Design
Noise factor becomes a signal.The focus of Robust Design
•
•
Minimize the Effects of Noise...
Minimize the Effects of Noise...
-
-
Most cost effective approach
Most cost effective approach
-
-
Select design parameter values so
Select design parameter values so
the system is least sensitive to
the system is least sensitive to
noises
noises
-
|
  Statistical Design of Experiments
Auto Brake System Example
Auto Brake System Example
Energy
Transformations
Energy
Transformations
Signal
Slow vehicle
down
smoothly
Slow vehicle
down
smoothly
“Smooth”
braking
“Smooth”
braking
Response
Noise Factors
•
Age of brakes
•
Road conditions
•
Ambient Temp.
Control Factors
•
Brake Pad Mat’l
•
Rotor Material
•
Brake Fluid
Torque
•
Pedal
force
|
  Statistical Design of Experiments
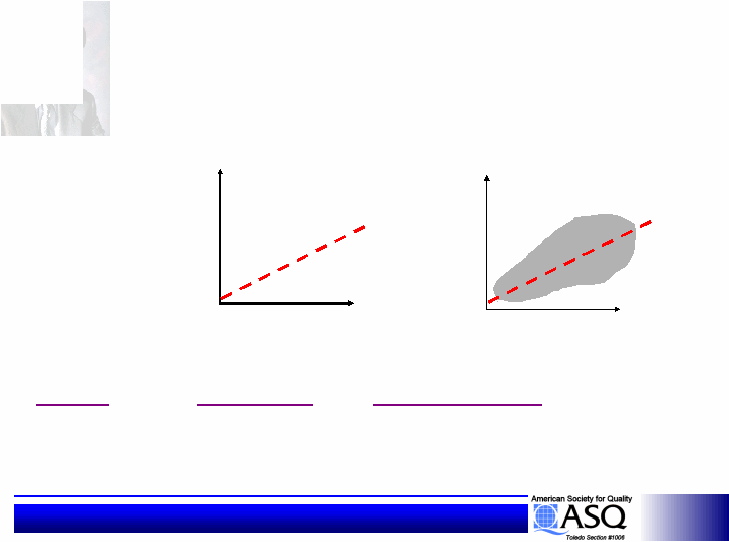
Ideal Thinking
Ideal Thinking
Energy Thinking
Energy Thinking
The ideal relationship
The ideal relationship
relationship
between input
between input
signal and output response based on
signal and output response based on
the energy
the energy
or information transformation
or information transformation
of the system.
of the system.
|
  Statistical Design of Experiments
Ideal Function
Ideal Function
X: Input Signal
Y: Output
Response
Y = f(X)
Reality
System
•
Brake pad
•
Motor
•
Coating
Input Signal
•
Force
•
Wattage
•
Time
Output Response
•
Torque
•
Torque*Rpm
•
Thickness
Y
X
|
  Statistical Design of Experiments
Don’t focus on “Symptoms”
Don’t focus on “Symptoms”
•
•
Customers complain about “symptoms”
Customers complain about “symptoms”
•
•
often not the desired output of the system
often not the desired output of the system
•
•
Focus on the ideal, desired response:
Focus on the ideal, desired response:
•
•
maximize the desired response
maximize the desired response
•
•
avoid moving energy from one symptom to
avoid moving energy from one symptom to
another
another
|
  Statistical Design of Experiments
Auto Brake System with
Auto Brake System with
“Symptoms”
“Symptoms”
Energy
Transformations
Energy
Transformations
Signal
Signal
Slow vehicle
down
smoothly
Slow vehicle
down
smoothly
“Smooth”
braking
“Smooth”
braking
Response
Response
Undesired:
Undesired:
•
•
Squeal
Squeal
•
•
Wear
Wear
•
•
Vibrations
Vibrations
•
•
“Symptoms”
“Symptoms”
Noise Factors
Noise Factors
•
•
Age of brakes
Age of brakes
•
•
Road conditions
Road conditions
•
•
Ambient Temp.
Ambient Temp.
Control Factors
Control Factors
•
•
Brake Pad Mat’l
Brake Pad Mat’l
Mat’l
•
•
Rotor Material
Rotor Material
•
•
Brake Fluid
Brake Fluid
Desired:
Desired:
Torque
Torque
•
•
Pedal
Pedal
force
force
|
  Statistical Design of Experiments
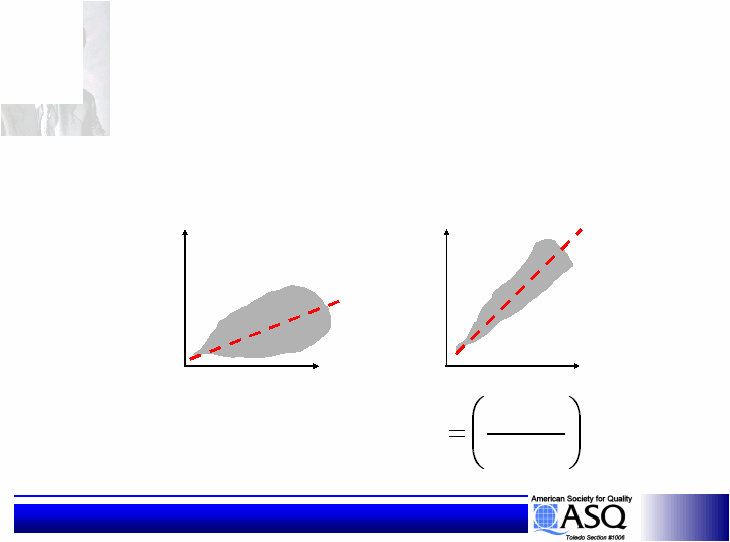
Robustness Metric
Robustness Metric
S/N Ratio
S/N Ratio
Goal: High S/N
Goal: High S/N
Y
Y
Y
Y
X
X
X
X
Signal/Noise Ratio
Signal/Noise Ratio
noise
signal
F
|
  Statistical Design of Experiments
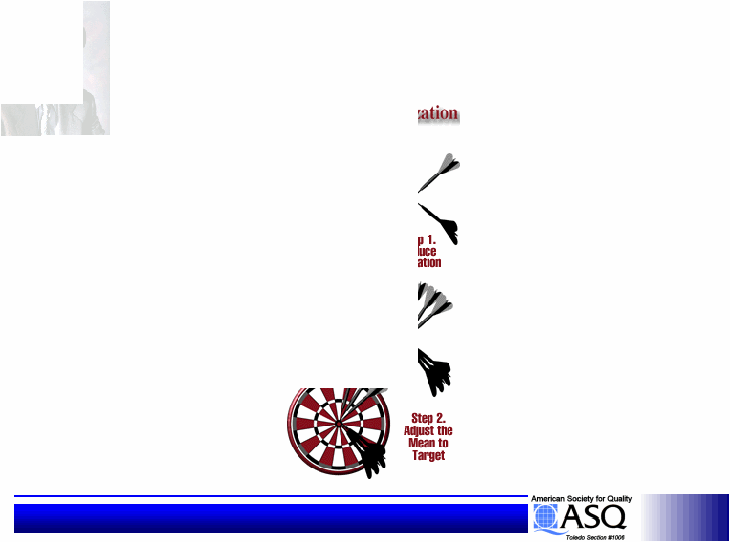
Two Step Optimization
Two Step Optimization
An optimized product or process
An optimized product or process
requires performance with:
requires performance with:
•
•
small variation about the mean, and
small variation about the mean, and
•
•
the mean adjusted to the design
the mean adjusted to the design
target.
target.
|
  Statistical Design of Experiments
Traditional Approach
Traditional Approach
1) Design to the target.
1) Design to the target.
2) Reduce the variability.
2) Reduce the variability.
initial design concept
initial design concept
optimized designs
optimized designs
Y
Y
X
X
target
target
Y
Y
X
X
target
target
Y
Y
X
X
target
target
|
   Statistical Design of Experiments
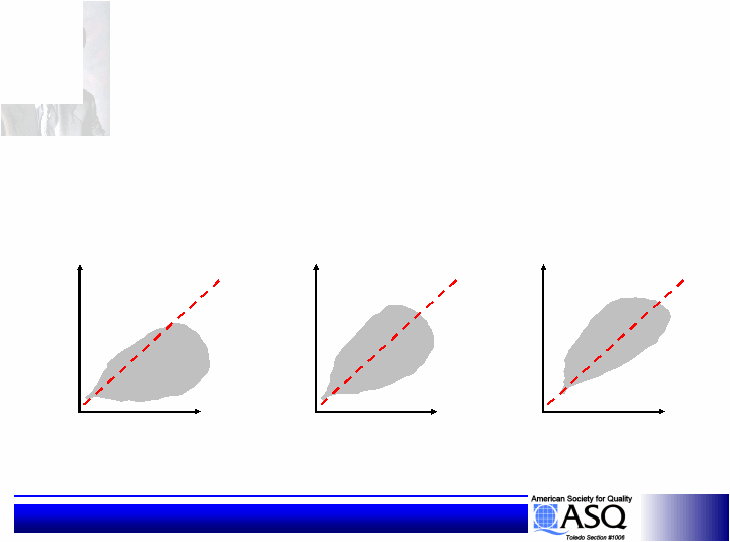
1) Reduce the variability.
1) Reduce the variability.
2) Design to the target.
2) Design to the target.
Y
Y
X
X
target
target
initial design concept
initial design concept
optimized designs
optimized designs
Y
Y
X
X
target
target
Y
Y
X
X
target
target
Robust Approach
Robust Approach
|
  Statistical Design of Experiments
Signal-to-Noise Definitions
Signal-to-Noise Definitions
Signal-to-Noise Analysis measures
Signal-to-Noise Analysis measures
variation within treatment
variation within treatment
combinations when noise is present.
combinations when noise is present.
Signal-to-Noise Analysis transforms all
Signal-to-Noise Analysis transforms all
treatment combination repetition data
treatment combination repetition data
to one value which is the measure of
to one value which is the measure of
variation present.
variation present.
Noise causes response variable results
Noise causes response variable results
to not be repeatable within a treatment
to not be repeatable within a treatment
combination.
combination.
Look at the repeatability within a
Look at the repeatability within a
treatment combination to
treatment combination to
determine the Signal-to-Noise
determine the Signal-to-Noise
Ratio.
Ratio.
S/N =
S/N =
Power of the Signal
Power of the Signal
Power of the noise
Power of the noise
Desire the power of the
Desire the power of the
signal to be great over
signal to be great over
the power of the noise
the power of the noise
The higher the S/N Ratio, the more the
The higher the S/N Ratio, the more the
system is robust (insensitive) to noise.
system is robust (insensitive) to noise.
Taguchi uses Design of Experiments to
Taguchi uses Design of Experiments to
determine where noise is affecting
determine where noise is affecting
response variable repeatability within a
response variable repeatability within a
treatment combination so that input
treatment combination so that input
factors can be optimized to decrease the
factors can be optimized to decrease the
uncontrollable noise effects.
uncontrollable noise effects.
|
  Statistical Design of Experiments
From Theory to Application
From Theory to Application
You’ve just learned
You’ve just learned
the basic background
the basic background
of Robust Design.
of Robust Design.
Now you’re ready to
Now you’re ready to
learn how to apply
learn how to apply
Robust Design
Robust Design
techniques in Day to
techniques in Day to
Day opportunities!
Day opportunities!
|
  Statistical Design of Experiments
Loss Function
Loss Function
Smaller -
Smaller -
the -
the -
Better
Better
L
L
O
O
S
S
S
S
I
I
N
N
$
T=O
T=O
L
L
/
/
Loss For
Loss For
One Piece
One Piece
L = K X²
L = K X²
2
Oil Consumption, Wear, Smoke, etc
Oil Consumption, Wear, Smoke, etc
Recall Taguchi Loss
Recall Taguchi Loss
Function
Function
Philosophy
Philosophy
–
–
Reduce variation
Reduce variation
around target
around target
–
–
Determine
Determine
nominal target
nominal target
Smaller-the-Better Signal-to-Noise
Smaller-the-Better Signal-to-Noise
= -10 Log (
X
I
2
/ N)
i=1
N
|
  Statistical Design of Experiments
Loss Function
Loss Function
Larger -
Larger -
the -
the -
Better
Better
Life Span
Life Span
Interest Rate
Interest Rate
Fuel Economy
Fuel Economy
Crop Yield
Crop Yield
L
L
O
O
S
S
S
S
I
I
N
N
$
L
L
Loss For
Loss For
One Piece
One Piece
L = K (1/X
L = K (1/X²)
2
)
n
Larger-the-Better Signal-to-Noise
Larger-the-Better Signal-to-Noise
= -10 Log (
= -10 Log (
1/X
1/X
I
I
2
2
/ N)
/ N)
i=1
i=1
N
N
|
  Statistical Design of Experiments
Torque
Torque
Temp
Temp
Dimensional
Dimensional
Values
Values
Loss Function
Loss Function
Nominal -
Nominal -
is -
is -
Best
Best
L
L
O
O
S
S
S
S
I
I
N
N
L
L
T
T
X
X
Loss For
Loss For
One Piece
One Piece
L = K (X-T)
L = K (X-T)
-T)
T)²
2
e
e
V
N
V
y
N
2
log
10
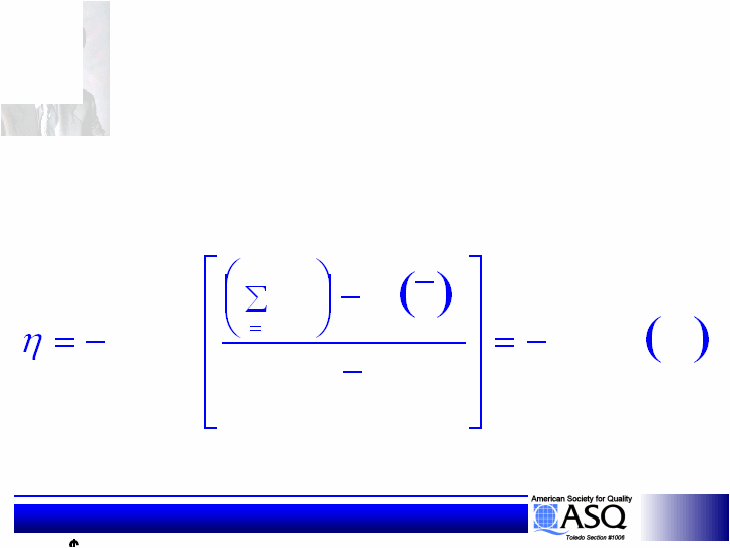
Nominal-the-Best Signal-to-Noise I
Nominal-the-Best Signal-to-Noise I
Nominal-the-Best Signal-to-Noise II
Nominal-the-Best Signal-to-Noise II
e
N
i
i
V
N
y
N
y
log
10
1
log
10
2
1
2
|
  Statistical Design of Experiments
1. Define project scope/objectives
1
. Define project scope/objectives
2. Identify Ideal Function
2. Identify Ideal Function
. Identify Ideal Function
3. Develop Signal & Noise Factor
3. Develop Signal & Noise Factor
. Develop Signal & Noise Factor
strategies
strategies
4. Establish Control Factors and Levels
4. Establish Control Factors and Levels
5. Conduct Experiments or Simulations
5. Conduct Experiments or Simulations
6. Conduct Data Analysis
6
. Conduct Data Analysis
7. Conduct Confirmation Run
7. Conduct Confirmation Run
. Conduct Confirmation Run
8. Implement & Document Results
8. Implement & Document Results
. Implement & Document Results
8 Steps of Parameter Design
8 Steps of Parameter Design
|
  Statistical Design of Experiments
Inner Arrays & Outer Arrays
Inner Arrays & Outer Arrays
Factors are generally divided into at least
Factors are generally divided into at least
two basic types:
two basic types:
Control factors are the factors which are
Control factors are the factors which are
to be optimized to attain the experimental
to be optimized to attain the experimental
goal.The optimum choice of control factor
goal.The optimum choice of control factor
Noise factors represent the
Noise factors represent the
uncontrollable elements of the system.
uncontrollable elements of the system.
levels should be robust over the noise
levels should be robust over the noise
factor levels.
factor levels.
Control and noise factors are usually handled
Control and noise factors are usually handled
differently in setting up an experiment.
differently in setting up an experiment.
Control factors are entered into an
Control factors are entered into an
orthogonal array called an inner array. The
orthogonal array called an inner array. The
noise factors are entered into a separate
noise factors are entered into a separate
array called an outer array. These arrays are
array called an outer array. These arrays are
so related that every testing set-up in the
so related that every testing set-up in the
-up in the
up in the
inner array is evaluated across every noise
inner array is evaluated across every noise
set-up in the outer array.
set-up in the outer array.
|
  Statistical Design of Experiments
Control Factors
Control Factors
A
A
B
B
C
C
(Inner Array)
(Inner Array)
Noise Factors
Noise Factors
L
L
M
M
N
N
(Outer Array)
(Outer Array)
1
2
3
4
L
1
1
1
2
2
M
2
1
2
1
2
N
3
1
2
2
1
A
B
C
1
2
3
1
1
1
1
2
1
2
2
3
2
1
2
4
2
2
1
Results
15 17 10 12
15 17 10 12
18 20 13 17
18 20 13 17
18 15 14 13
18 15 14 13
23 16 19 15
23 16 19 15
|
  Statistical Design of Experiments
Gold Plating Experiment
Gold Plating Experiment
System:
System:
Gold plating process
Gold plating process
Output response:
Output response:
y
y
-
-
Plating thickness (
Plating thickness (
m)
m)
Minimum specification:
Minimum specification:
50
50
m
m
= 76
= 76
m
m
= 7.5
= 7.5
y
Current Condition
Current Condition
|
  Statistical Design of Experiments
Noise Factor
Noise Factor
Level 1
Level 1
Level 2
Level 2
N:
N:
Part Location
Part Location
in plating tank
in plating tank
Off-center
Off-center
Center
Center
A:
A:
Gold Concentration
Gold Concentration
0.70-0.75
0.70-0.75
1.10-1.15
1.10-1.15
Control Factors
Control Factors
Level 1
Level 1
Level 2
Level 2
Level 3
Level 3
B:
B:
Current Density
Current Density
2.0
2.0
1.5
1.5
1.0
1.0
C:
C:
Temperature
Temperature
95
95
105
105
115
115
D:
D:
Barrel Speed
Barrel Speed
10
10
15
15
20
20
E:
E:
Anode Size
Anode Size
1/4
1/4
1/2
1/2
1/1
1/1
F:
F:
Load Size
Load Size
1/4
1/4
1/3
1/3
1/2
1/2
G:
G:
pH
pH
4.20
4.20
4.30
4.30
4.40
4.40
H:
H:
Nickel Concentration
Nickel Concentration
600
600
650
650
700
700
|
  Statistical Design of Experiments
L
18
A
B
C
D
E
F
G
H
1
1
1
1
1
1
1
1
1
83
88
90
91
27.9
88.00
2
1
1
2
2
2
2
2
2
73
73
83
81
23.4
77.50
3
1
1
3
3
3
3
3
3
57
58
65
69
20.7
62.25
4
1
2
1
1
2
2
3
3
55
59
61
67
21.6
60.50
5
1
2
2
2
3
3
1
1
73
75
76
79
29.6
75.75
6
1
2
3
3
1
1
2
2
58
60
68
72
19.8
64.50
7
1
3
1
2
1
3
2
3
44
49
55
58
18.3
51.50
8
1
3
2
3
2
1
3
1
50
54
57
64
19.6
56.25
9
1
3
3
1
3
2
1
2
64
65
66
68
31.7
65.75
10
2
1
1
3
3
2
2
1
74
79
86
94
19.6
82.25
11
2
1
2
1
1
3
3
2
75
78
90
94
19.2
84.50
12
2
1
3
2
2
1
1
3
70
76
85
88
19.7
79.75
13
2
2
1
2
3
1
3
2
71
80
87
95
18.2
83.25
14
2
2
2
3
1
2
1
3
48
56
59
65
18.1
57.00
15
2
2
3
1
2
3
2
1
66
67
79
86
17.7
74.50
16
2
3
1
3
2
3
1
2
45
53
58
64
17
2
3
2
1
3
1
2
3
60
67
66
73
18
2
3
3
2
1
2
3
1
57
65
79
83
Note: Two Readings were measured on each plated part
N1
N2
y
|
  Statistical Design of Experiments
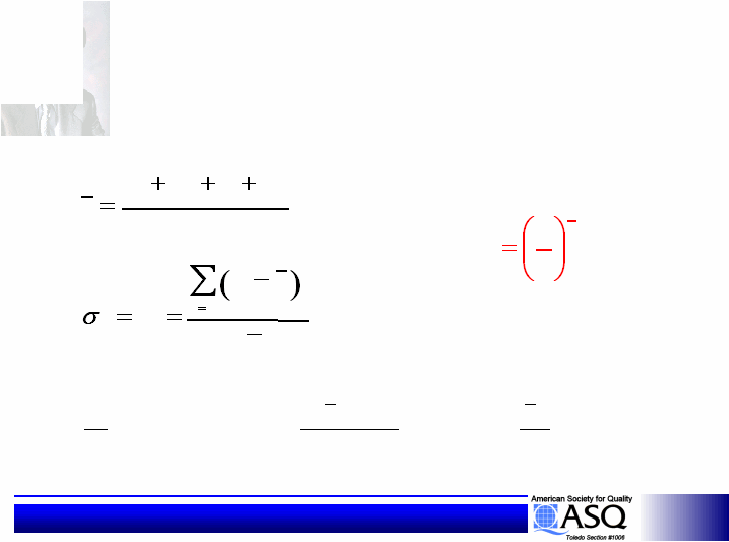
S/N Ratio Concept
S/N Ratio Concept
n
n
y Around Mea
y Around Mea
Variabilit
Variabilit
an
an
Effect of Me
Effect of Me
N
N
S
S
S/N Ratio Calculation
Note: For x
dB gain in S/N,
initial
x
opt
Range
RANGE
*
2
1
6
.
n
y
y
y
y
n
...
2
1
n
1
1
2
2
n
y
y
V
i
i
e
(dB
)
(
)
(
)
÷
÷
ø
ö
ç
ç
è
æ
=
ú
û
ù
ê
ë
é
-
=
=
2
2
2
log
*
10
log
*
10
s
h
y
V
n
V
y
n
N
S
e
e
For n data: y
For n data: y
1
1
y
y
2
2
y
y
3
3
…y
…y
n
n
|
  Statistical Design of Experiments
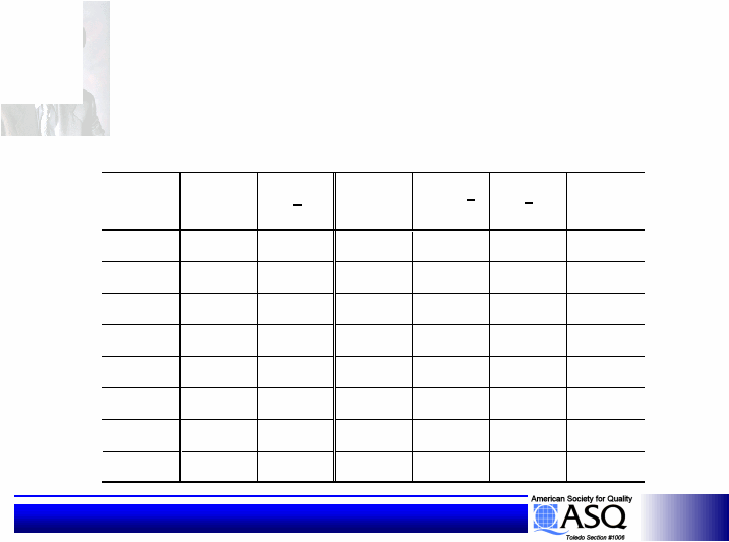
Response Tables
Response Tables
A
B
C
D
E
F
G
H
1
21.7
20.4
23.3
19.7
21.2
21.6
2
20.8
21.9
20.7
19.8
21.6
21.4
3
20.6
20.8
19.1
23.6
20.3
20.1
1.1
1.5
4.2
3.9
1.3
1.5
* in (dB)
Factor
Response Table (S/N)*
Level
Response Table
Level
Factor
A
B
C
D
E
F
G
H
1
66.9
70.3
73.3
73.0
70.2
74.8
2
72.8
69.6
73.1
69.2
69.6
71.8
3
69.6
63.0
67.3
69.6
62.9
5.9
0.7
4.2
5.7
0.6
11.9
y
|
  Statistical Design of Experiments
Two Step Optimization
Two Step Optimization
1.
1.
Reduce Variability (maximize S/N)
Reduce Variability (maximize S/N)
2.
2.
Adjust mean to target
Adjust mean to target
A
B
C
D
E
F
G
H
Factor
Factor
Affect
Affect
S/N
S/N
Affect
Affect
Affect
Affect
S/N
S/N
Affect
Affect
S/N &
S/N &
Affect
Affect
Affect
Affect
Neither
Neither
y
y
y
|
  Statistical Design of Experiments
E1
E1
1
E2
E2
2
23-
22-
21-
20-
19-
18-
T
E3
E3
3
Prediction -
Prediction -
Using Additivity
Using Additivity
A1
A1
1
A2
A2
2
23-
22-
21-
20-
19-
18-
T
D1
D1
1
D2
D2
2
23-
22-
21-
20-
19-
18-
T
D3
D3
3
G1
G1
1
G
G
2
2
G3
G3
3
23-
22-
21-
20-
19-
18-
T
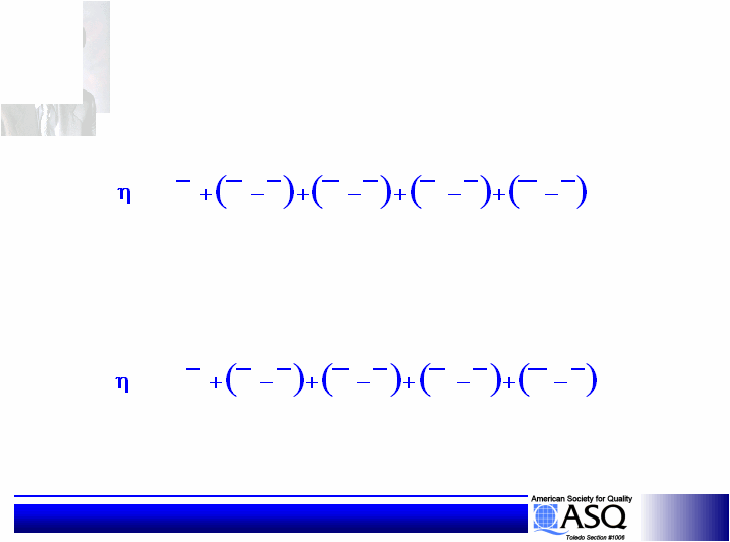
Prediction Equation
Prediction Equation
T
G
T
E
T
D
T
A
T
opt
=
1
3
1
1
ˆ
= 21.0+(23.6-21.0)+(23.3-21.0)+(23.6-21.0)+(23.9-21.0)
= 21.0+(23.6-21.0)+(23.3-21.0)+(23.6-21.0)+(23.9-21.0)
+(23.6-21.0)+(23.3-21.0)+(23.6-21.0)+(23.9-21.0)
(23.6-21.0)+(23.3-21.0)+(23.6-21.0)+(23.9-21.0)
-21.0)+(23.3-21.0)+(23.6-21.0)+(23.9-21.0)
21.0)+(23.3-21.0)+(23.6-21.0)+(23.9-21.0)
+(23.3-21.0)+(23.6-21.0)+(23.9-21.0)
(23.3-21.0)+(23.6-21.0)+(23.9-21.0)
-21.0)+(23.6-21.0)+(23.9-21.0)
21.0)+(23.6-21.0)+(23.9-21.0)
+(23.6-21.0)+(23.9-21.0)
(23.6-21.0)+(23.9-21.0)
-21.0)+(23.9-21.0)
21.0)+(23.9-21.0)
+(23.9-21.0)
(23.9-21.0)
-21.0)
21.0)
= 31.4 dB
= 31.4 dB
Suppose the initial design was A
Suppose the initial design was A
2
2
B
B
2
2
C
C
2
2
D
D
2
2
E
E
2
2
F
F
2
2
G
G
2
2
H
H
2
2
T
G
T
E
T
D
T
A
T
initial
=
2
2
2
2
ˆ
= 21.0+(18.5-21.0)+(20.7-21.0)+(19.8-21.0)+(20.1-21.0)
= 21.0+(18.5-21.0)+(20.7-21.0)+(19.8-21.0)+(20.1-21.0)
= 16.1 dB
= 16.1 dB
|
  Statistical Design of Experiments
Confirmation Run
Confirmation Run
Conduct conformation runs for the initial
Conduct conformation runs for the initial
and the optimum designs
and the optimum designs
Calculate the S/N ratios for both designs,
Calculate the S/N ratios for both designs,
and compare to the predicted S/N ratios:
and compare to the predicted S/N ratios:
S/N
Prediction
Confirmation
Variable Data
Initial Design
16.1 dB
Optimum
Design
31.4 dB
Gain
15.3 dB
Once the S/N ratio is confirmed (variability
Once the S/N ratio is confirmed (variability
reduction confirmed), observe the mean of
reduction confirmed), observe the mean of
the confirmation run, then adjust it to target.
the confirmation run, then adjust it to target.
20.1 dB
20.1 dB
31.9 dB
31.9 dB
11.8 dB
11.8 dB
5
.
7
,
76
1
n
y
2
.
2
,
87
1
n
y
|