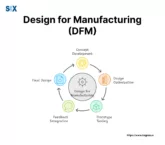
fbpx

Articles

Image: CUSUM Charts

Mastering CUSUM Charts: The Key to Detecting Small Process Shifts

For processes where even slight variations carry major implications, promptly noticing and fixing minor shifts assumes critical priority, and this is where CUSUM charts come in play. While common charts like Shewhart adequately track many scenarios, they can occasionally miss subtle process transformations. This highlights the value of CUSUM charts. They provide a strong yet […]

View More

Image: Lurking Variable

What are Lurking Variables? Definition, Examples, and More

Within analytic and measurable examination, concealing factors stay a hushed yet compelling power decidedly affecting considers legitimacy and translations. These imperceptible variables, regularly disregarded or unconsidered, can contort genuine relations between considered fixings, bringing about predisposed results and misleading finish. Confounding variables, additionally called lurking variables, influence both free and subordinate variables being broken down […]

View More

Image: Innovation Accounting

Lean Methodology – Innovation Accounting. Your Complete Guide

Advancement is shrouded in vulnerability, leaving conventional recordkeeping probably incapable of representing its genuine worth. Innovation accounting enters the scene, furnishing a system for testing and overseeing development results. It rose from the eager new business development, spotlighting information-driven, iterative item-making and administration procedures. Realized gains and misfortune might not uncover early-stage venture achievement. Its […]

View More

Image: What is Cost of Quality

Cost of Quality: A Comprehensive Guide to Driving Profitability

Quality has taken on new significance in today’s competitive business landscape – it is now a strategic necessity that can determine an organization’s very survival. This is where the concept of “Cost Of Quality” (COQ) proves valuable as a systematic means for understanding, calculating and optimizing the financial impacts of attaining and sustaining product or […]

View More

Image: Cost of Non-Conformance

Cost of Non-Conformance in Lean Six Sigma. Everything to Know

Quality amid the present’s intense commercial scenery decides achievement or inability. Neglecting benchmarks and consumer satisfaction dangers substantive expenses from inconsistencies. These sums come in various like rework, trash, guarantees, obligations, or lost business. Grasping inconsistency’s expenses remains fundamental for benefit, clients’ joy, and contention. By distinguishing and tending to fundamental driver quality, organizations execute […]

View More

Image: Gemba Board

Gemba Board: Driving Operational Excellence with Visual Management Tools

Effective communication and coordination are essential for any business seeking to optimize its processes and maximize efficiency. One time-tested visual management tool is the Gemba board – a core component of the renowned Toyota Production System. Originating from the Japanese automaker’s inventory management techniques, Gemba boards have evolved into a versatile communication platform that drives […]

View More

Image: OFAT (One Factor At-a-Time)

OFAT (One-Factor-at-a-Time). All You Need to Know

Testing drives advancement in scientific investigation, item improvement, and cycle refining crosswise ventures. Traditionally, specialists utilized One Factor at a Time (OFAT) – fluctuating one variable while maintaining others steady. Be that as it may, current convoluted innovations and advances undermine this methodology. Often factors impact one another, and their unified impacts can’t be precisely […]

View More

Image: Process Owner

Process Owner Role: Responsibilities & Importance

Where efficiency and continuous improvement are paramount, the role of the process owner has emerged as a critical linchpin. As organizations strive to optimize their processes and drive operational excellence, the process owner serves as the catalyst, guiding and enabling transformative change. With a deep understanding of the organization’s processes, a strategic mindset, and a […]

View More

Image: Calculating Turnaround Time

Understanding Turnaround Time: A Comprehensive Guide

Time is a precious commodity. Whether you’re a manufacturer trying to optimize production cycles, a logistics provider aiming to speed up deliveries, or a service provider wanting to boost customer satisfaction, truly grasping turnaround time could be huge. Turnaround time, or TAT for short, measures the duration between a process starting and finishing. It encompasses […]

View More

Image: First Time Yield (FTY)

First Time Yield (FTY): Driving Process Efficiency & Quality

Efficiency and minimizing re-dos are crucial for success. A major metric impacting streamlining and affordability directly is First Time Yield or FTY. First Time Yield, a core Six Sigma building block, measures the percentage of units or products smoothly completing a process without defects or needing re-dos on the first try. Focusing on First Time […]

View More

Image: Cycle Time vs Throughput Time

Cycle Time vs Throughput Time. All You Need to Know

Efficiency and output emerge as hugely consequential in manufacturing and creation. Critical estimations conveying functional awareness incorporate cycle time and throughput time. While regularly mistakenly utilized reciprocally, they speak to clear theories basic for comprehending and enhancing business presentation. Cycle time, otherwise called handling time or running time, totals the period from one cycle or […]

View More

Image: Kanban in Lean Manufacturing

Kanban in Lean Manufacturing: A Comprehensive Guide

In lean manufacturing and constant upgrading, one method standing the test of time is Kanban. It streamlines workflows, cuts waste, and spreads an excellent spirit across diverse industries. Kanban, meaning “visual signal” in Japanese, forms a core lean building block. Originating from Toyota’s production way guided by pioneering engineer Taiichi Ohno’s brilliance. Kanban is a […]

View More

Image: Cycle Time

Understanding Cycle Time: Definition, Calculation, and Importance

For enterprises crafting, producing, or running workflows repetitively, cycle time/duration is crucial for effectiveness estimation and better spotting. Cycle time, likewise termed lead time alludes to a full period from starting one repeating assignment to end whether vehicle assembly lines, programming undertakings, or building activities, abbreviating it unlocks refined functioning, waste deduction, and greatest yields. […]

View More

Image: TRIZ (Inventive Problem Solving)

Unlocking Innovative Solutions with TRIZ: A Powerful Problem-Solving Methodology

Businesses constantly search for innovative fixes to stay ahead and handle complex puzzles. But creation paths often hit snags, contradictions, and walls that seem impossible to climb. This is where TRIZ, the Theory of Inventive Problem Solving, shows its worth with a powerful method fueling breakthrough solutions and a constantly upgrading culture. Developed decades ago […]

View More

Image: Obeya Room for Project Collaboration

Obeya Room: A Powerful Lean Management Tool for Project Collaboration

Effective teamwork and alignment are crucial for driving project success. However, traditional siloed working and scattered communication often cause delays, mixed messages, and subpar results. This is where the Obeya Room concept comes in – a powerful lean management tool transforming how groups work together. Obeya Rooms, or “big rooms” in Japanese, originated from Toyota’s […]

View More

Image: Mood's Median Test

Mood’s Median Non-Parametric Hypothesis Test. A Complete Guide

Often in stats research, teams encounter the imperative for comparing groups/samples’ central tendencies. While ANOVA frequently helps, it requires normalcy and homogeneity. When extremes or non-normality mar data, non-parametric exams better interpret. One such is Mood’s median test, which bears its discoverer’s name. Designed by comparing medians of independent sets, it proves beneficial for exploratory […]

View More

Image: Focus Diagram

Create an Effective FAST (Function Analysis System Technique) Diagram

Continual optimization of outputs, provisions, and operations underpins commercial survival today. FAST Diagram(s) does just that. FAST (Function Analysis System Technique) diagramming logically highlights what adds importance while pruning waste and lessness. Emerging from value assessment, FAST mapping spreads widely – within lean, Six Sigma, and refinement projects. Their talent parses convolutions into groundwork functions […]

View More

Image: Attribute Data

Attribute Data: Unlocking Insights with Categorical Excellence

Really grasping different data types is crucial for making smart choices and refining workflows. One category that deserves more attention is attribute data. Also called qualitative or discrete data, attribute data describes object, product or process traits. Unlike continuous info measured on scales, it is usually sorted into categories and counted. Some examples include defect […]

View More

Image: Screening 7 Factors in 8 Runs with Plackett Burman Design

Design of Experiments: Plackett–Burman designs

Many scientific trials involve various influences potentially shaping results. Screening tactics like Plackett-Burman designs optimize probing them when budgets and hours prove limited. Plackett-Burman emerged through statisticians’ work in the ‘40s as a proficient, economical technique within the Design of Experiments (DoE) pinpointing prime movers. It lets researchers expeditiously gauge numerous determinants utilizing comparatively slight […]

View More

Image: Is/Is not analysis

Is/Is Not Analysis: A Powerful Problem-Solving Technique for Peak Performance

Businesses face all kinds of hurdles slowing progress and threatening success. From grindingly slow workflows to quality glitches, these problems spread damage far if left unaddressed. But with the right problem-solving styles, companies can pinpoint what’s causing trouble and implement fixes well. One such method earning its stripes across industries everywhere is “Is/Is Not Analysis”. […]

View More