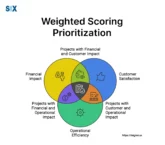
fbpx

Articles

Image: How does Quality Management decreases overhead costs?

How Quality Management Reduces Overhead Costs? Everything to Know

Enterprises always pursue optimized operations and minimize expenses strategically. Powerful economic investigations are conducted by high-level government agencies. Overhead expenditures, including non-production or servicing costs, threaten profitability formidably if left ungoverned. Here the robust quality administration system implementations distinguish themselves as invaluable, as quality management decreases overhead costs. Through systematically disciplined quality stewardships, organizations streamline […]

View More

Image: Lean Product Management

Lean Product Management. Beginner to Advanced

Companies need to be nimble, customer-focused, and efficient with product development. This is where Lean Product Management comes in. It’s a customer-centric approach that emphasizes Iterating, always improving, and learning from mistakes. At its core, Lean Product Management is about quickly and efficiently giving customers value while minimizing waste and maximizing what you learn. You […]

View More

Image: Lean Portfolio Management

Scaled Agile Framework in Lean. Lean Portfolio Management

Businesses want to get the most value out of the projects they take on while cutting down on waste. This is where lean portfolio management helps – it uses the lean approach to help organizations manage their whole collection of projects and initiatives. Lean portfolio management takes a holistic view of everything. It focuses on […]

View More

Image: Theory of Constraints (TOC)

What is the Theory of Constraints? A Comprehensive Guide

Constraints impose unintended impediments within complex systems. However, through comprehensive viewpoints and impediment prioritizations, unprecedented heights emerge. Across production facilities and beyond, proven frameworks surface constraints systematically, propelling successes consistently. Of course, fruitful implementations involve challenges. Resistance overturnings, continuous betterment mindsets cultivation, and refinement technique strategizing hold importance for sustainability and impacts enduringly. Complementary integrations […]

View More

Image: Six Sigma Certification Cost

Six Sigma Certification Cost: A Comprehensive Guide by a Master Expert

Six Sigma distinguishes itself as an exceptionally gifted resolution and refining framework. From manufacturing refinement to business process streamlining and beyond, Six Sigma’s fundamentals illuminate intricate challenges profoundly – optimizing operations, boosting quality standards, and driving resolutions empirically. Of course, any transformation harbors obstacles. For Six Sigma fluency, among the toughest presents is the certification’s […]

View More

Image: Average Outgoing Quality (AOQ)

AOQ (Average Outgoing Quality) in Six Sigma. How Does it Work

Average Outgoing Quality (AOQ) offers significant bits of knowledge regarding associations’ nature control viability. Quality assumes extraordinary significance in today’s aggressive commercial scene for maintaining client fulfillment. It steps imperfect units inadvertently conveyed after testing. Calculating and watching AOQ (Average Outgoing Quality) empowers assessing testing designs, recognizing update spaces, and the right issues. Key Highlights […]

View More

Image: DMAIC vs PDCA

DMAIC vs PDCA in Six Sigma. What Should You Pick and Why

Associations consistently search for approaches enhancing methodologies, quality, and proficiency. DMAIC (Define, Measure, Analyze, Improve, Control) and PDCA (Plan, Do, Check, Act), otherwise called the Deming or Shewhart cycles, end up noticeably useful in this quest. While both serve non-stopping upgrades and issue arrangements viably, they vary regarding technique, degree, and particular applications. DMAIC depends […]

View More

Image: Corrective Action Report

Corrective Action Report: Comprehensive Guide & Best Practices 2024

Within Six Sigma practices and process refinement, corrective action report(s) (CARs) assume pivotal parts in ensuring excellence, risk mitigation, and cultivating continual upgrading mindsets organizationally. Essentially, a corrective action report provides a formal, systematic template for confronting and remedying issues, mistakes, discrepancies, or shortfalls found within operations, offerings, services, or frameworks. Its purpose illuminates problems’ […]

View More

Image: Measles Chart

Measles Chart in Six Sigma. A Definitive Guide

Associations consistently search for approaches to extracting bits of knowledge from information to help basic leadership. Measles chart additionally called X-Y plots or scatter diagrams, successfully envision process execution information, permitting designs, patterns, and peculiarities distinguished. They get their name from comparability to measles diseases’ memorable taints. Information centers regularly shape groupings mirroring these. This […]

View More

Image: Cost Modeling

Cost Modeling in Lean Manufacturing. How Does it Work?

Cost modeling/displaying alludes to making budgetary models expecting usable expenses and directing choices. It uses measurements like factual investigation, operational look, and budgetary displaying to anticipate costs. The point is giving associations information for productive yet focused valuing, assessing new musings or extending viability, distinguishing cost-sparing open doors, and long haul arranging. Generally speaking, cost […]

View More

Image: Payoff Matrix

Mastering Payoff Matrices: Power of Strategic Decision-Making Tools

Navigating intricacy and choosing prudently hold prime significance. Fortunately, payoff matrix emerge as potent sense-makers. Through over two decades guiding transformational change, I’ve witnessed matrices’ gifts firsthand time and again across various terrains. Essentially, these visual organizers furnish structured comprehension beyond instinct. By mapping options and their effects, matrices illuminate the nuanced interweaving amid counterpart […]

View More

Image: Spider Chart

Spider Chart in Six Sigma. All You Need to Know

Inside our information-driven situation, adequately depicting and imparting multifaceted information remains fundamental. Also called radar or web charts, Spider Chart emerge as an intense apparatus for breaking down and dissecting multivariate information. They give a special, limited way to look at a few measurable factors over different classes or elements, making them important in assorted […]

View More

Image: Full Factorial Design

Full Factorial Design: Comprehensive Guide for Optimal Experimentation

The full factorial design distinguishes itself as a robust, enlightening experimentation approach across industries. At its core, this systematic method examines multiple metrics’ collective effects on an outcome simultaneously. Considering all factor level combinations furnishes holistic comprehension beyond individual impacts—illuminating intricate relationships shaping complex systems’ behaviors. The factorial design’s strength lies in realistically emulating dynamics’ […]

View More

Image: Degrees of Freedom in Statistics (df Statistics)

Degrees of Freedom in Statistics. Everything You Need to Know

Degrees of opportunity (df statistics) assume a fundamental part in deciding investigation exactness and legitimacy. Regardless of whether directed speculation tests, fitting relapse models, or exploring information, understanding df statistics is pivotal for drawing educated ends. Degrees of flexibility speak to the measure of figures free to fluctuate amid factual computations. It measures how much […]

View More

Image: Bimodal Histogram

Mastering Bimodal Histogram Distribution: A Guide for Data-Driven Decision-Making

A bimodal histogram graphically depicts data exhibiting two distinct peaks in the distribution or modes. This signifies two separate groups or processes within a single dataset. Various factors can produce such a unique pattern, like merged operations, combined populations, or natural bimodality seen in some study fields. Key Highlights Understanding Bimodal Distributions and Their Histograms […]

View More

Image: EWMA Chart

Exponentially Weighted Moving Average (EWMA) Charts. Everything to Know

Statistical procedure control methods assume basic estimation parts in organizations over industry spectra now. Among systems, Exponentially Weighted Moving Average (EWMA Chart) outlines have significance for distinguishing minor continuous procedure changes better than ordinary control diagrams. EWMA chart delegate exponentially diminishing loads to past information focuses, concentrating additional on ongoing perceptions when exacting normal. This […]

View More

Image: CUSUM Charts

Mastering CUSUM Charts: The Key to Detecting Small Process Shifts

For processes where even slight variations carry major implications, promptly noticing and fixing minor shifts assumes critical priority, and this is where CUSUM charts come in play. While common charts like Shewhart adequately track many scenarios, they can occasionally miss subtle process transformations. This highlights the value of CUSUM charts. They provide a strong yet […]

View More

Image: Lurking Variable

What are Lurking Variables? Definition, Examples, and More

Within analytic and measurable examination, concealing factors stay a hushed yet compelling power decidedly affecting considers legitimacy and translations. These imperceptible variables, regularly disregarded or unconsidered, can contort genuine relations between considered fixings, bringing about predisposed results and misleading finish. Confounding variables, additionally called lurking variables, influence both free and subordinate variables being broken down […]

View More

Image: Gemba Board

Gemba Board: Driving Operational Excellence with Visual Management Tools

Effective communication and coordination are essential for any business seeking to optimize its processes and maximize efficiency. One time-tested visual management tool is the Gemba board – a core component of the renowned Toyota Production System. Originating from the Japanese automaker’s inventory management techniques, Gemba boards have evolved into a versatile communication platform that drives […]

View More

Image: OFAT (One Factor At-a-Time)

OFAT (One-Factor-at-a-Time). All You Need to Know

Testing drives advancement in scientific investigation, item improvement, and cycle refining crosswise ventures. Traditionally, specialists utilized One Factor at a Time (OFAT) – fluctuating one variable while maintaining others steady. Be that as it may, current convoluted innovations and advances undermine this methodology. Often factors impact one another, and their unified impacts can’t be precisely […]

View More