The Definitive Guide to Spaghetti Diagrams: Streamlining Processes
Spaghetti diagram is a powerful lean visualization tool that allows you to quite literally untangle the knots in your processes.
With just a glance, you can identify redundancies, wasteful movement, and areas ripe for optimization.
Visualize and eliminate process inefficiencies by effectively using Spaghetti Diagrams
Learn to streamline workflows with our Lean Six Sigma Green Belt Certification.
What is a spaghetti diagram? It’s a simple yet insightful diagram that maps out the flow and sequence of steps within a process.
By tracing the “noodles” of movement across your layout, you can pinpoint areas of excessive travel, delays, inefficient paths, and more.
Spaghetti diagrams shine a light on the often-unseen waste lurking within everything from manufacturing lines to hospital procedures.
Key Highlights
- Defining Spaghetti Diagrams
- Fundamentals
- Step-by-step creation methods
- Advanced strategies
- Before-and-after transformations
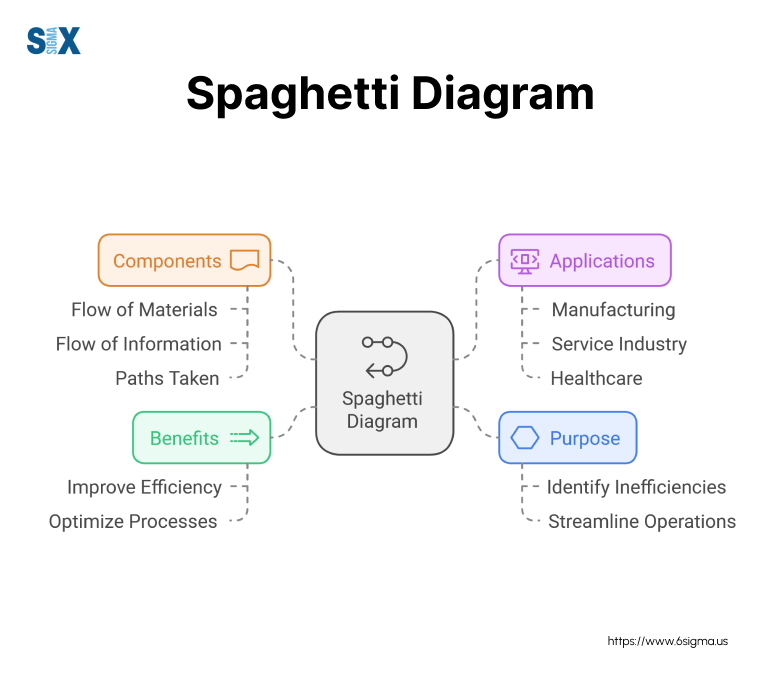
What is a Spaghetti Diagram?
A spaghetti diagram (also known as a spaghetti chart, spaghetti model, or spaghetti plot) is a powerful lean visualization tool used to map out the flow and movement within a process.
The name comes from the resemblance of the diagram’s crisscrossing lines to a plate of spaghetti noodles.
A spaghetti diagram helps identify redundancies, inefficiencies, and waste in the form of unnecessary movement, transport, and waiting times.
By tracing the physical paths that materials, information, or people travel, spaghetti diagrams shine a spotlight on areas ripe for improvement.
Common use cases include optimizing manufacturing lines, hospital procedures, warehouse layouts, office workflows, and more.
Whenever there is an opportunity to streamline processes by reducing distances, touches, or motion waste, a spaghetti diagram can be an invaluable tool.
Lean Six Sigma and Spaghetti Diagram
Spaghetti diagrams are a staple tool in both lean manufacturing and Six Sigma methodologies.
In a lean context, they empower efforts to eliminate the 8 types of waste, especially motion, transport, and waiting waste.
From a Six Sigma perspective, spaghetti diagrams are an effective way to map out and analyze processes to identify defects, variability, and opportunities for optimization.
Individuals working toward Six Sigma certification must develop proficiency in tools such as spaghetti diagrams to detect inefficiencies and propel process improvements through data analysis
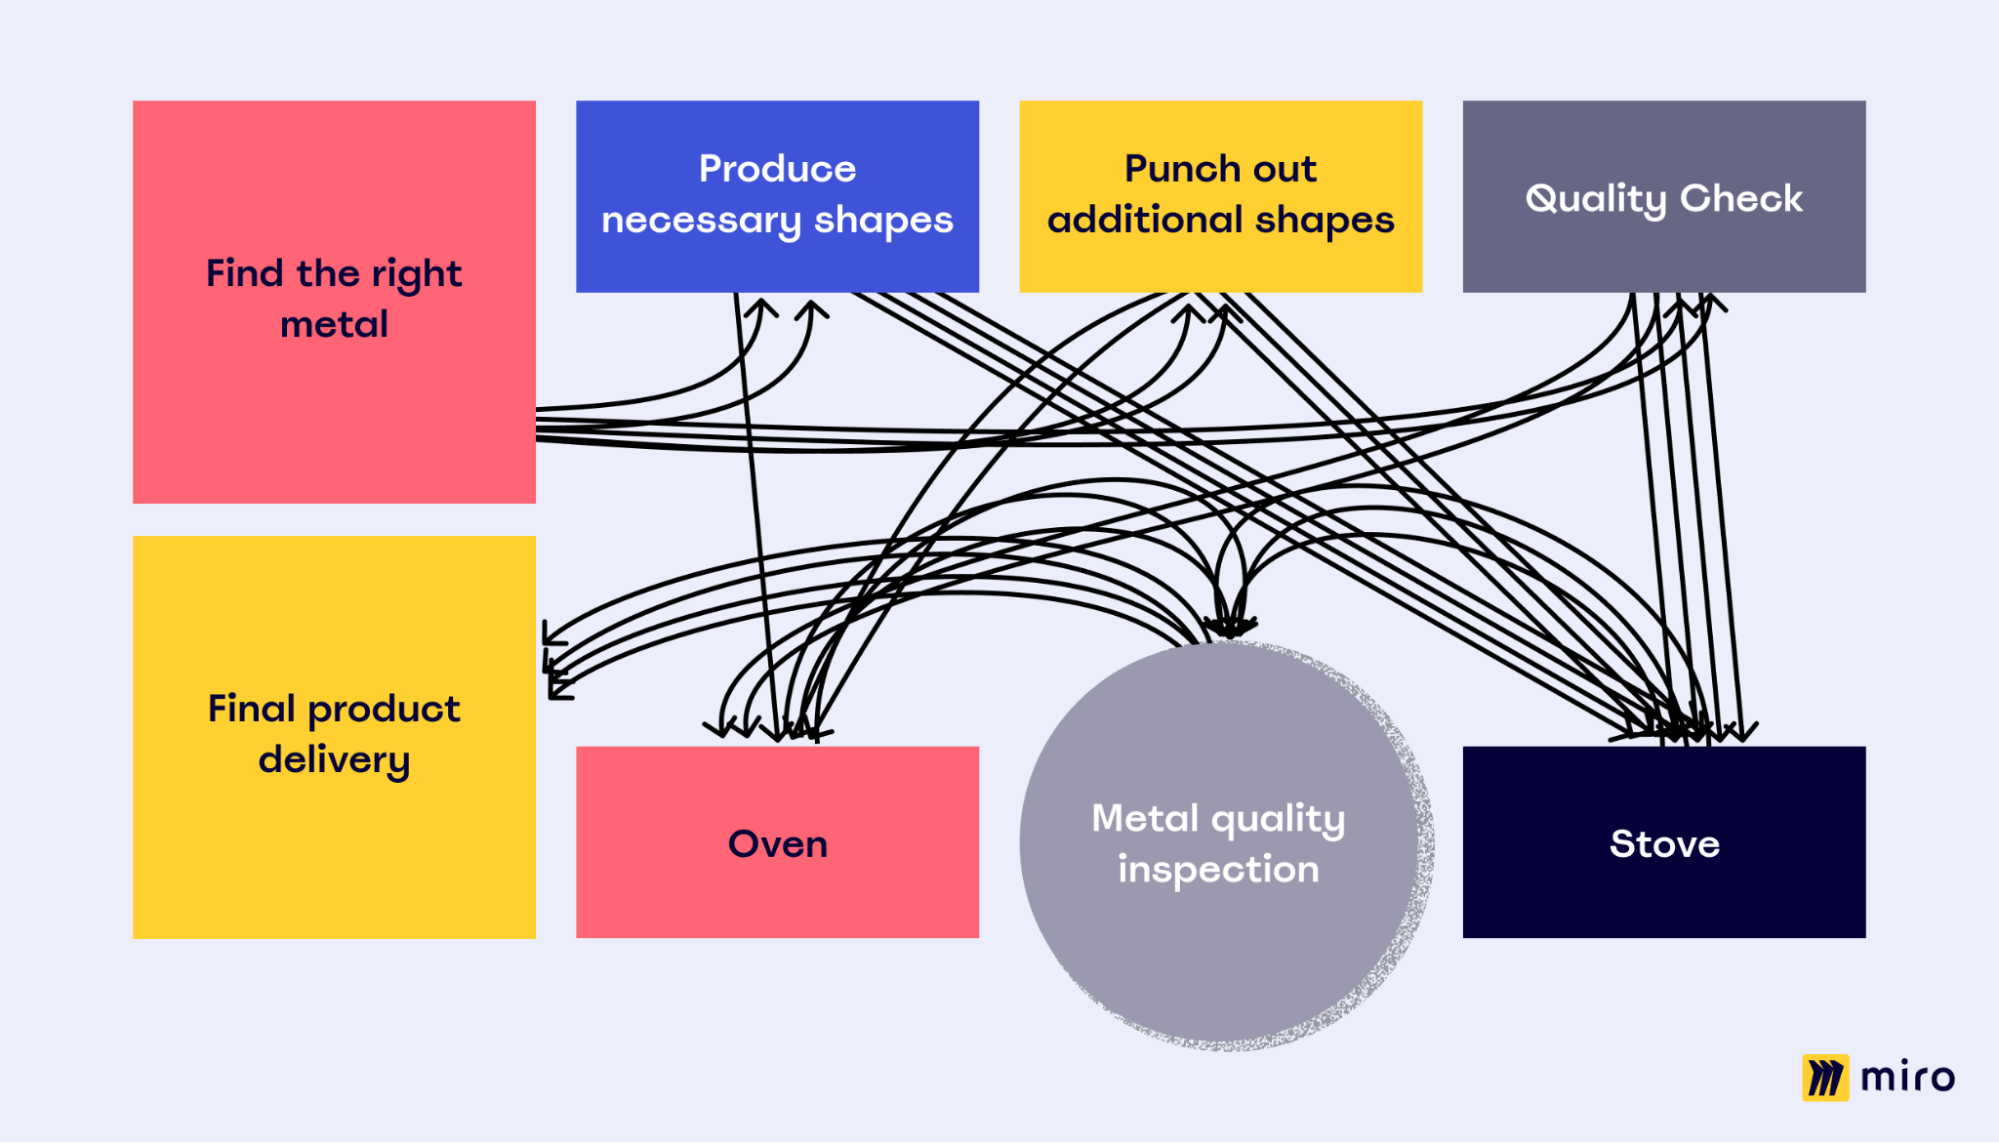
Here is an example of a Spaghetti Diagram:
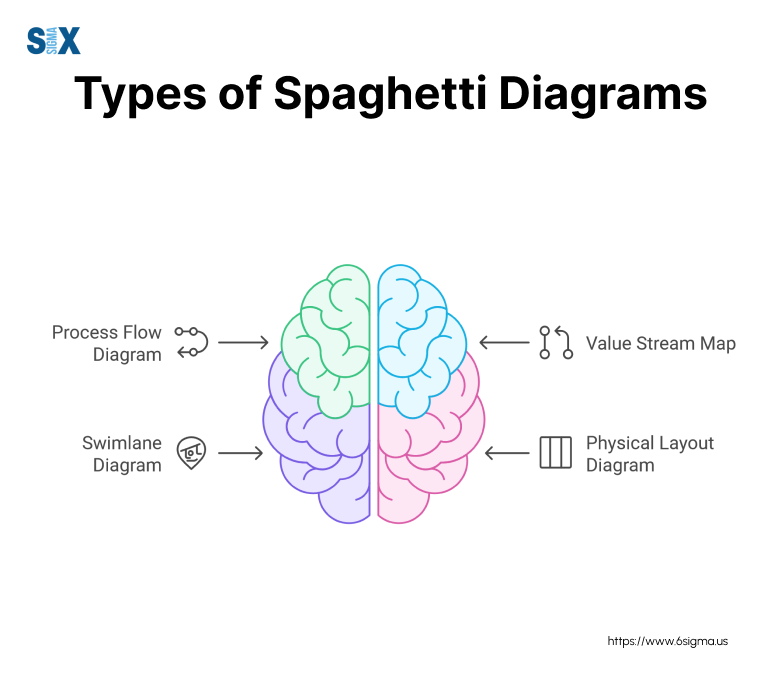
Types of Spaghetti Diagrams
While the fundamental concept is the same, there are a few different types of spaghetti diagrams that can be employed depending on the situation:
2D Spaghetti Diagram – The classic, two-dimensional spaghetti diagram maps out movements across a top-down view of the facility layout. This is best for relatively simple, single-plane processes.
3D Spaghetti Diagram – For environments with multiple levels or vertical considerations, a 3D spaghetti diagram can be created. This provides a more holistic view of the true distances and paths involved.
Value Stream Spaghetti Diagram – This type integrates spaghetti diagrams directly into value stream mapping efforts. Movements are layered on top of the value stream map to analyze flow inefficiencies.
Digital Spaghetti Diagram – While traditional spaghetti diagrams are hand-drawn, digital diagramming tools can enhance the process with precise virtual layouts, measurements, simulations, and data integration capabilities.
More types can be defined as:
The type used depends on the complexity of the environment and the specific goals of the mapping effort.
Digital 3D spaghetti diagrams combined with value stream mapping tend to be most powerful, but can require more technical expertise.
Key Metrics a Spaghetti Diagram Helps Analyze
One of the key strengths of spaghetti diagrams is their ability to quantify and measure process metrics in a tangible way. Some of the most important metrics they can shed light on include:
Travel Distance – Being able to visualize and calculate the total distance traveled for materials or operators is critical for identifying movement waste.
Process Cycle Times – With logged start/stop times, spaghetti diagrams can map out the time spent on particular process steps and segments.
Throughput and Takt Times – Analyzing the flow between workstations illuminates bottlenecks and opportunities to improve throughput rates.
Inventory Levels – Mapping material flows highlights areas where excess inventory may be building up between phases.
Resource Utilization – Spaghetti diagrams can expose instances where equipment, space, or personnel are underutilized.
Combining spaghetti diagrams with root cause analysis training ensures teams can systematically address inefficiencies
How a Spaghetti Diagram Fits into Lean Six Sigma Methodologies
Spaghetti diagrams are an integral tool that supports the core principles and practices of both lean and Six Sigma in several ways:
Lean Principles
Understanding lean fundamentals—like minimizing motion waste—is foundational for interpreting spaghetti diagrams
- Identifying sources of motion, transport, and waiting wastes
- Enabling just-in-time material/information flow
- Supporting continuous improvement and kaizen events
- Optimizing cellular layouts and value stream designs
Six Sigma
- Serving as an input to define, measure, and analyze processes
- Quantifying process data (cycle times, defects, etc.)
- Uncovering root causes of process variations and deficiencies
- Validating and measuring the impact of improvements
Whether taking a lean approach, Six Sigma methodology, or a combined lean Six Sigma strategy, spaghetti diagrams provide an indispensable level of visual insight to drive data-driven process enhancements.
Earning a Six Sigma certification equips you with the analytical skills to leverage spaghetti diagrams for reducing process variations and validating improvements.
Unlock the power of lean process optimization with our Lean Six Sigma Yellow Belt Certification
Drive continuous improvement and eliminate waste with essential tools like spaghetti diagrams.
Step-by-Step Guide to Creating a Spaghetti Diagram
Now that you understand the “what” and “why” behind spaghetti diagrams, let’s dive into the “how” with a comprehensive step-by-step guide.
Creating effective spaghetti diagrams is a skill that takes practice, but this proven process will set you up for success.
Prepare for the Diagramming Process
Identify the process(es) you want to analyze and map. A spaghetti diagram can cover anything from a single workstation to an entire facility.
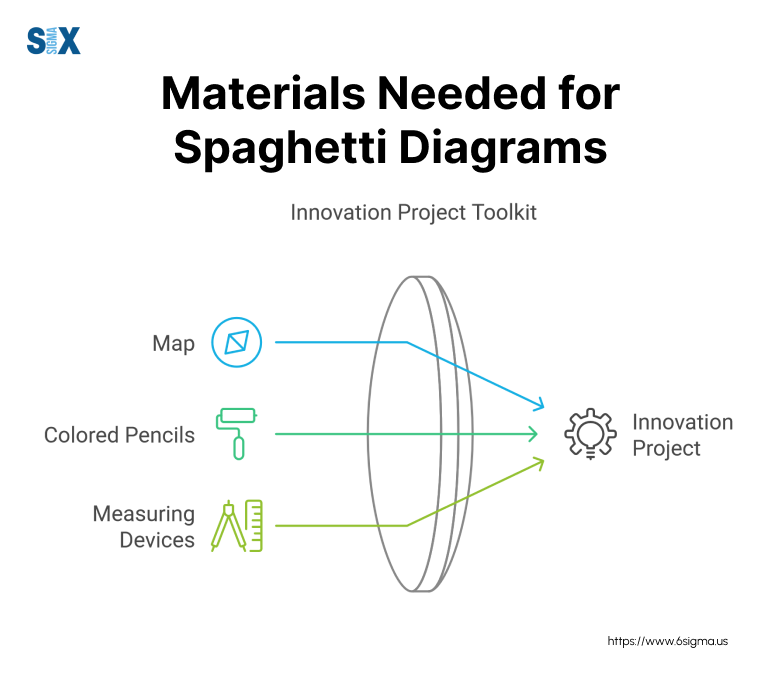
Gather your materials. At a minimum, you’ll need:
- Detailed floor plan or layout of the area
- Colored pencils/markers
- Measuring device (measure wheel, app, etc.)
Involve the right team members who have direct experience with the process. Their input will be invaluable.
For deeper training on quantifying waste metrics, explore our Six Sigma Green Belt Certification, which covers advanced process mapping techniques
Map the Physical Environment
Using your floor plan, draw out the physical layout including workstations, machines, storage areas, aisles, entrances/exits.
Mark out obstructions like columns, floor markings, etc. The more detail, the better.
Create a scaled layout representation. This allows you to precisely measure distances later on.
Record the Sequence of Movements
Observation is key here. Have an operator walk through the process start-to-finish at a normal pace.
Use a different colored line to trace their path, capturing every stop, turn, and motion without lifting your pencil.
For multiple operators or materials, continue using new colors for each pathway.
Time movements with a stopwatch and note measurements if desired.
Pro Tips:
- Use spaghetti diagram tools or apps for precise digital mapping
- Video record for playback and analysis
- Observe multiple cycle iterations to identify variations
Analyze the Spaghetti Diagram to Find Waste
With your tangled spaghetti diagram, you can now identify:
- Excess travel distances between steps
- Unnecessary movement redundancies
- Waiting times and process bottlenecks
- Underutilized spaces or inventory buildup areas
Leverage lean waste principles like 5S, value stream mapping, and cycle time analysis.
Calculate key metrics enabled by your spaghetti diagram:
- Total distance traveled
- Process lead/cycle times
- Percentage of value-added vs non-value-added activities
Map the Optimized Future State
Using your analysis, reposition activities and flows on the diagram to:
- Reduce motion waste with straight-line layouts
- Implement work cells and continuous flow
- Remove redundant transport paths
- Allow for flexible scaling and line balancing
Compare before and after states to quantify projected improvements.
Implement Changes and Continuously Improve
Develop a realistic implementation plan accounting for costs, timelines, training, etc. After rolling out changes, conduct follow-up spaghetti diagram sessions.
Identify new opportunities and make adjustments as needed.
Take your process optimization abilities to the next level. Learn to develop and integrate comprehensive spaghetti diagrams in our comprehensive Green Belt program.
Advanced Spaghetti Diagramming Strategies
While the core spaghetti diagram process is relatively straightforward, there are advanced strategies to consider for more complex environments and specialized use cases:
Handling Complex Processes and Layouts
For facilities with high variability, numerous intersections, or multi-level/3D elements, traditional 2D spaghetti diagrams may not tell the full story.
Advanced diagramming methods include:
- 3D Modeling: Create dimensionally accurate virtual facility models to map complete material/personnel flows.
- Value Stream Spaghetti Diagrams: Layer movement paths directly onto value stream maps for integrated analysis.
- Simulation: Use spaghetti diagram data to run process simulations and “what-if” scenarios before implementing changes.
For example, an automotive manufacturer used 3D simulations with spaghetti diagrams to streamline engine assembly lines across multiple levels, reducing cycle times by 22%.
Specialized Lean Applications of Spaghetti Diagram
While invaluable for general process mapping, spaghetti diagrams can also drive more specialized lean objectives:
- Line Balancing: Visualize operator movements to level workloads and optimize line spacing.
- Demand Analysis: Map material flows from suppliers through production to anticipate demand amplifications.
- Cellular Workflows: Design optimized cell layouts with continuous flow and minimal transport waste.
Quantifying Performance Metrics
For Lean Six Sigma practitioners, spaghetti diagrams take on added value by precisely quantifying process data:
- Non-Value-Added Times: Calculate the time spent on transport, motion, and waiting vs. value-adding activities.
- True Distances: Measure the total distances employees/materials travel to identify distance-based inefficiencies.
- Financial Impact: Translate waste into bottom-line costs using takt times, labor rates, material costs, etc.
Spaghetti diagram examples from Six Sigma deployments show how capturing and analyzing these metrics enables data-driven process improvement.
Advanced Diagramming Tools
While manual diagramming provides a simple start, more advanced spaghetti diagram tools are emerging to enhance the process:
- 3D Virtual Facility Mapping: Build spatially accurate 3D environment models to diagram within.
- Augmented Reality: Use AR headsets to overlay spaghetti diagrams directly onto real-world facility layouts.
- AI/Video Analysis: Leverage computer vision and AI to automatically map personnel/material flows.
By combining spaghetti diagrams with immersive technologies, training and implementation become highly interactive experiences.
These are just some of the cutting-edge strategies used by innovators in the lean manufacturing space.
As you can see, spaghetti diagrams pack a powerful punch – especially when applied with an advanced, integrated approach.
Become a lean expert with our Black Belt course which prepares you to lead cutting-edge process optimization initiatives and drive strategic excellence through advanced spaghetti diagramming techniques and emerging technologies.
Uses of Spaghetti Diagrams
While powerful in manufacturing, spaghetti diagram applications extend far beyond the factory floor:
- Healthcare: Mapping patient, staff, and equipment flows to optimize hospital layouts and processes
- Construction: Analyzing temporary work zones, material staging, and crew travel paths
- Office Environments: Studying document/information flows and personnel movements
- Product Design: Diagramming steps in an assembly or repair process
The core technique translates anywhere that mapping physical flows and movements is beneficial.
Innovative New Applications to Consider
As technology evolves, so do the possibilities with spaghetti diagrams:
- Virtual Reality: Creating immersive 3D facility simulations to collaboratively diagram and analyze
- Video Tracking: Using AI to automatically generate spaghetti diagrams by analyzing surveillance footage
- Building Information Modeling (BIM): Integrating diagrams into BIM platforms for construction projects
- Digital Twins: Incorporating real-time spaghetti diagrams into facility digital twins for remote monitoring
With creativity and the right tools, spaghetti diagrams can continue finding innovative applications that drive process excellence.
Conclusion
Whether you’re a seasoned lean practitioner or just beginning your continuous improvement journey, spaghetti diagrams are a powerful tool no operation should be without.
Their simplicity belies their remarkable ability to reveal even the most deeply-rooted process inefficiencies and wasteful movements.
Throughout this guide, we’ve explored the fundamentals of spaghetti diagrams, their role across lean six sigma methodologies, and step-by-step approaches for leveraging them in your environment.
From basic process mapping to advanced 3D simulations with digital twins, spaghetti diagrams continue evolving to meet modern needs.
Innovative applications for creative problem-solving, new industries, and emerging technologies only amplify their future potential.
Now it’s your turn to unlock that potential.
The path to optimized processes, reduced waste, and increased throughput begins with a spaghetti diagram.
Whether driving plant floor transformations or rethinking office workflows, this humble tool packs a powerful punch.
Take your first step towards operational excellence – start diagramming today!
SixSigma.us offers both Live Virtual classes as well as Online Self-Paced training. Most option includes access to the same great Master Black Belt instructors that teach our World Class in-person sessions. Sign-up today!
Virtual Classroom Training Programs Self-Paced Online Training Programs


