Regression Analysis in Six Sigma: A Data-Driven Approach
Organizations implementing Six Sigma methodologies need reliable ways to measure and improve process performance.
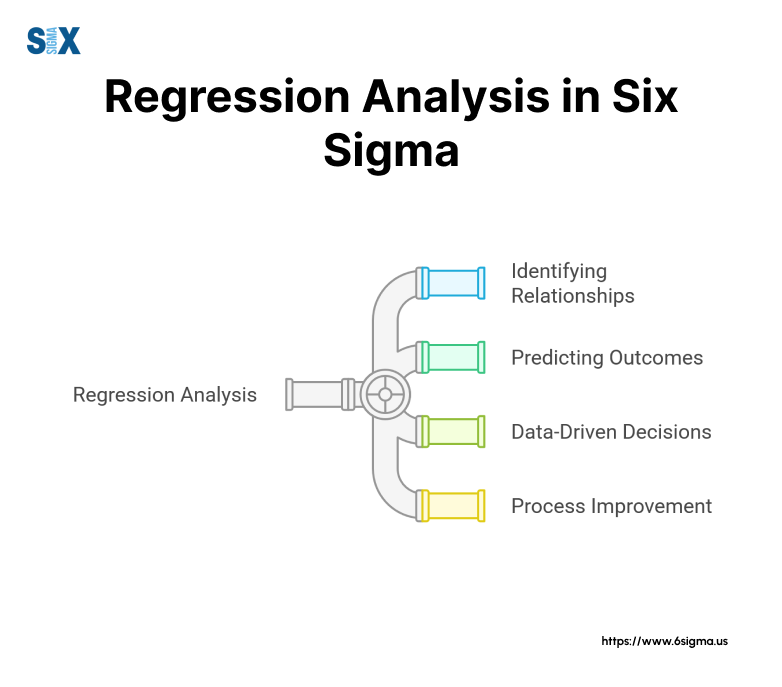
Regression analysis provides the statistical foundation for:
- Identifying critical process inputs
- Quantifying relationships between variables
- Predicting future process outcomes
- Validating improvement initiatives
Quality professionals and Six Sigma practitioners use these insights to reduce defects, minimize variation, and optimize processes across industries.
The growing integration with machine learning and automated analysis tools continues to expand regression analysis capabilities in modern improvement projects.
Key Highlights
- Statistical methods for process optimization
- Root cause identification techniques
- Predictive modeling approaches
- Real-time monitoring capabilities
What Is Regression Analysis?
Regression analysis serves as a statistical method that identifies relationships between variables in Six Sigma projects.
This powerful tool helps quality professionals predict outcomes and optimize processes by analyzing how changes in one variable affect another.
When implemented correctly in Six Sigma initiatives, regression analysis reveals hidden patterns and correlations that drive process improvements.
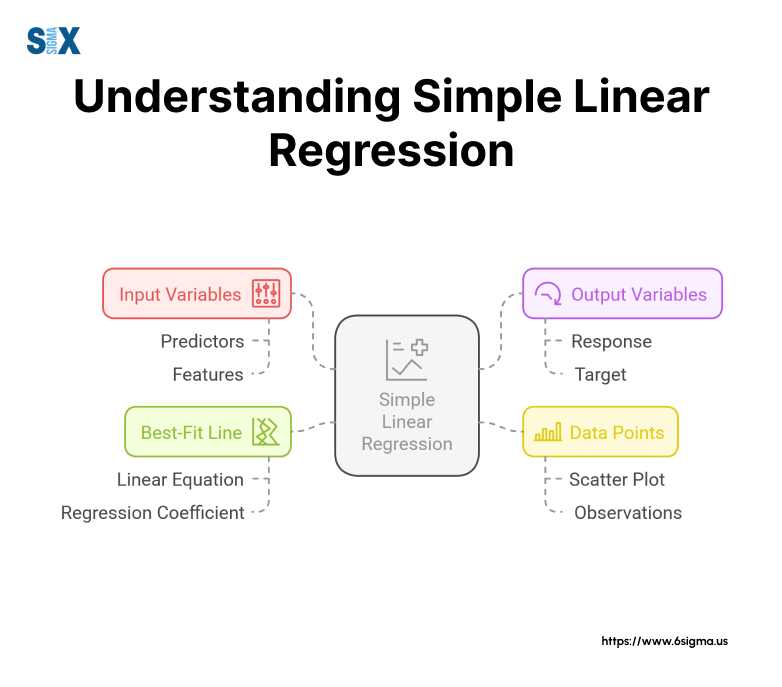
The technique quantifies relationships between input variables (predictors) and output variables (responses), enabling teams to make data-backed decisions.
Key Applications of Regression Analysis in Six Sigma
Quality teams use regression analysis throughout the DMAIC (Define, Measure, Analyze, Improve, Control) methodology.
During the Analysis phase, this statistical approach pinpoints root causes of defects and variations. The Improve phase leverages regression models to validate solution effectiveness before full implementation.
Modern Six Sigma projects increasingly rely on regression analysis for real-time process monitoring and predictive analytics.
Software tools now automate complex calculations, allowing practitioners to focus on interpreting results and driving improvements.
Six Sigma Methodology: Foundation For Process Excellence
Six Sigma represents a data-driven methodology that focuses on reducing process variations and defects.
Organizations implement Six Sigma to achieve measurable financial results while improving customer satisfaction.
The methodology uses statistical tools to identify and eliminate sources of variation, with a goal of achieving 3.4 defects per million opportunities.
Quality teams measure process performance using sigma levels, where higher levels indicate better performance.
Moving from three sigma to six sigma performance leads to significant improvements in quality, cost reduction, and customer satisfaction.
Key Elements of Six Sigma
The methodology relies on statistical thinking and metrics to drive decisions.
Use various tools and techniques to measure current performance, analyze data patterns, and implement sustainable solutions.
Statistical analysis, including regression techniques, forms the backbone of Six Sigma projects.
With our Six Sigma Champion Leadership Program master verified approaches that deliver measurable business results.
Understanding The DMAIC Framework
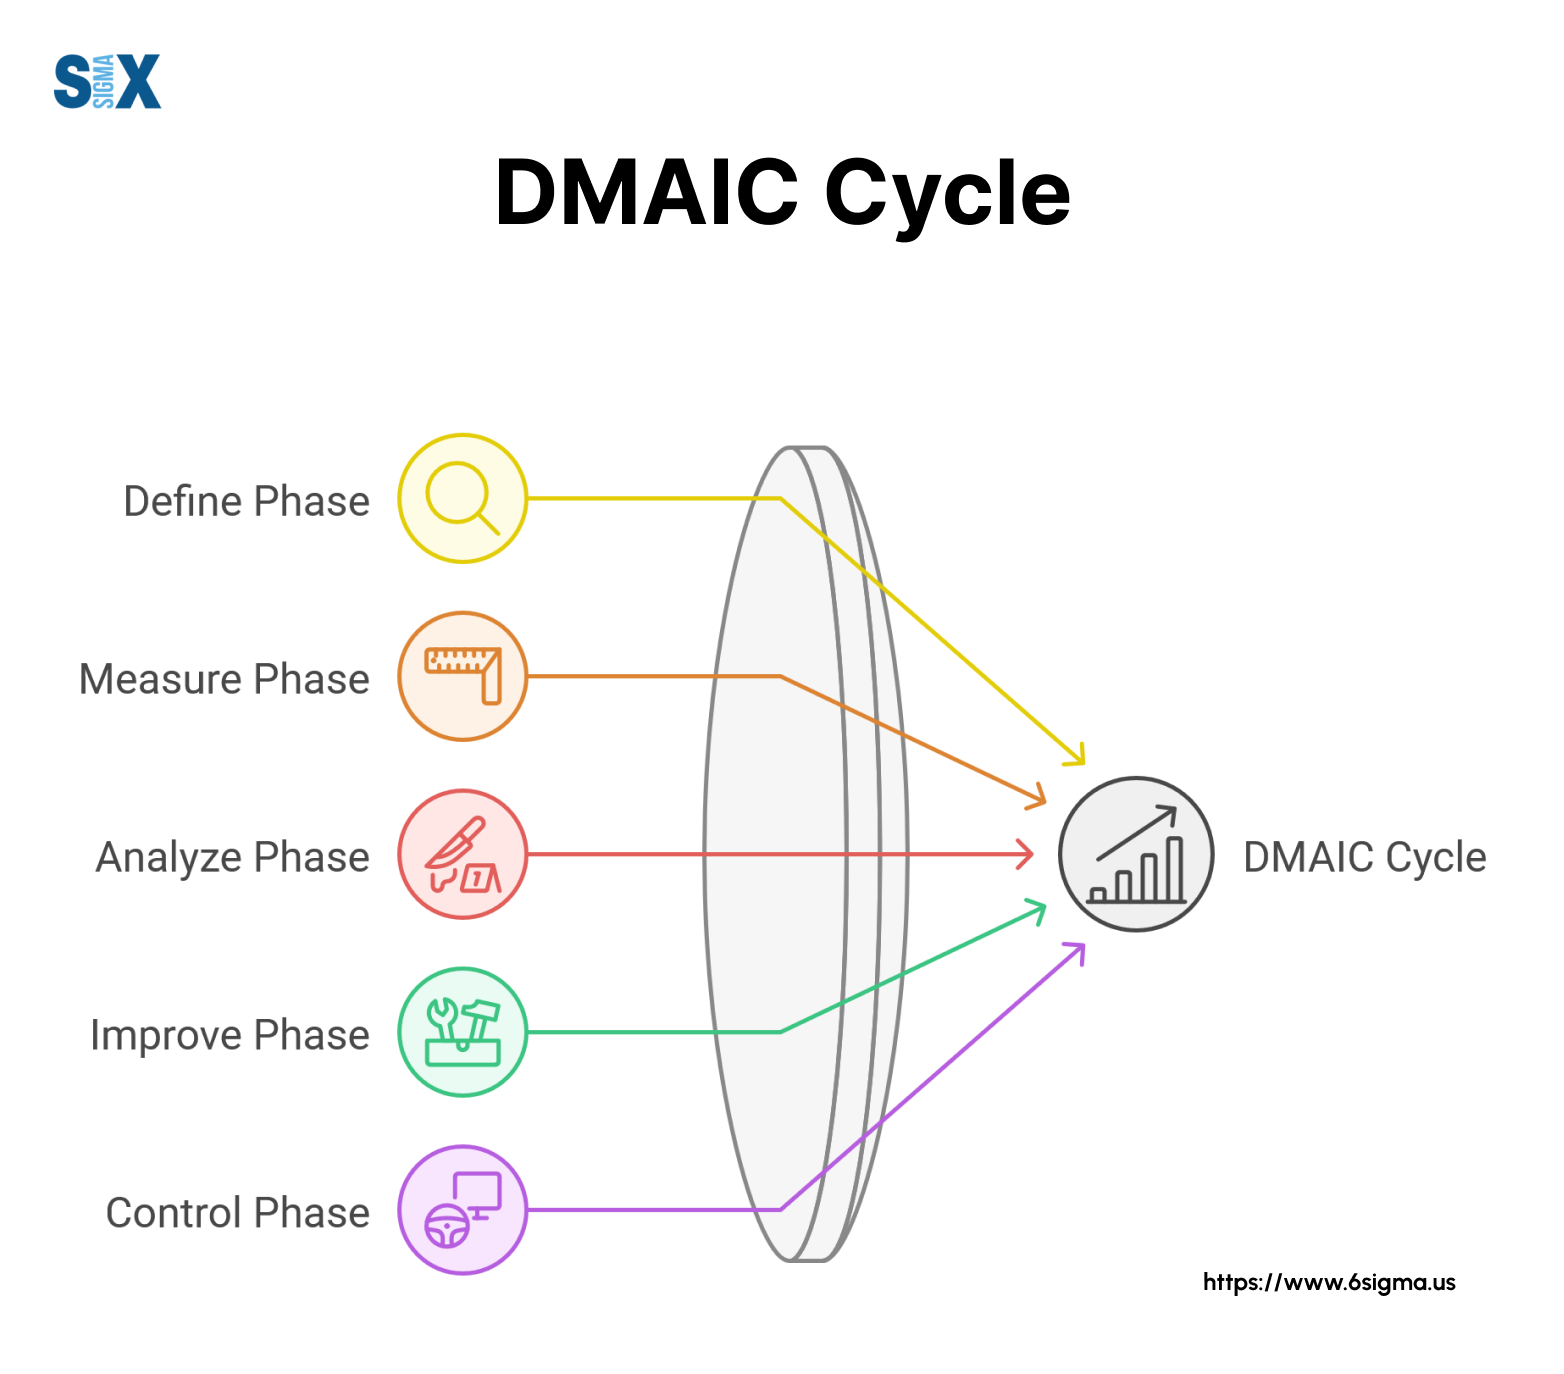
DMAIC provides a structured approach to problem-solving in Six Sigma projects. Each phase builds upon the previous one, creating a logical progression toward process improvement:
- Define: Teams identify project goals and customer requirements
- Measure: Data collection establishes baseline performance
- Analyze: Statistical tools reveal root causes of problems
- Improve: Solutions address identified root causes
- Control: Monitoring ensures sustained improvements
Role of Regression Analysis In DMAIC
Regression analysis plays a crucial role throughout the DMAIC process, particularly in project management and analysis phases. During the Analyze phase, teams use regression techniques to:
- Identify relationships between process inputs and outputs
- Quantify the impact of different variables
- Validate potential root causes
- Predict process performance
The Improve phase leverages regression models to test potential solutions before implementation. Teams use these analyses to:
- Optimize process settings
- Predict improvement outcomes
- Validate solution effectiveness
- Guide implementation decisions
Integration With Project Management
Project managers use regression analysis to track progress and make informed decisions. The statistical insights help teams:
- Monitor project metrics
- Forecast completion timelines
- Allocate resources effectively
- Justify improvement initiatives
Modern Six Sigma projects increasingly rely on automated analysis tools that streamline regression calculations. This evolution allows project managers to focus on interpreting results and driving improvements rather than performing complex calculations manually.
Data-Driven Decision Making with Regression Analysis
Regression analysis transforms raw data into actionable insights for project teams. Quality professionals use these insights to:
- Prioritize improvement opportunities
- Allocate project resources
- Validate improvement results
- Demonstrate project value
The integration of regression analysis with project management tools continues to evolve, enabling more efficient and effective process improvement initiatives.
Types of Regression Analysis
Six Sigma practitioners employ several regression analysis methods based on project requirements and data characteristics.
Simple linear regression examines relationships between two variables, while multiple regression handles complex processes with numerous inputs.
Linear regression models straight-line relationships between variables, making it ideal for basic process improvements.
Nonlinear regression tackles more complex relationships, often found in chemical processes or advanced manufacturing operations.
Logistic regression addresses scenarios with binary outcomes, such as pass/fail testing or defect prediction.
This method helps quality teams forecast probabilities of specific events or outcomes in their processes.
Common Regression Methods in Six Sigma
- Simple Linear Regression: Models basic cause-and-effect relationships
- Multiple Regression: Analyzes multiple input variables simultaneously
- Polynomial Regression: Handles curved relationships between variables
- Logistic Regression: Predicts binary outcomes in processes
Essential Regression Concepts
Quality professionals must grasp key terminology to effectively implement regression analysis in Six Sigma projects.
The dependent variable represents the process output being studied, while independent variables are the inputs potentially affecting that output.
The regression equation describes the mathematical relationship between variables.
The coefficient of determination (R-squared) measures how well the model fits the data, helping teams assess prediction accuracy.
Critical Statistical Terms
Residuals indicate the difference between predicted and actual values, helping teams assess model accuracy.
P-values determine statistical significance, guiding teams in identifying meaningful relationships between variables.
Standard error measurements reveal the precision of regression estimates, while confidence intervals provide ranges for predicted values. These metrics help quality professionals make informed decisions about process improvements.
Mathematical Foundation of Regression
The basic regression equation follows the format:
Y = β0 + β1X + ε
Where:
- Y = Dependent variable (process output)
- β0 = Y-intercept
- β1 = Slope coefficient
- X = Independent variable (process input)
- ε = Error term
This equation forms the basis for more complex regression models used in Six Sigma projects.
Teams use least squares estimation to find the best-fitting line through their data points, minimizing prediction errors.
Practical Application of Regression Analysis
Quality teams apply these mathematical concepts through statistical software, focusing on interpretation rather than manual calculations.
Modern tools automate complex computations, allowing practitioners to concentrate on:
- Selecting appropriate regression models
- Interpreting statistical outputs
- Making data-driven decisions
- Implementing process improvements
Understanding these fundamentals enables Six Sigma practitioners to effectively use regression analysis for process optimization and quality improvement initiatives.
Role of Regression Analysis in Process Improvement
Regression analysis serves as a primary statistical tool in Six Sigma projects, enabling teams to quantify relationships between process variables.
Quality professionals use regression techniques to measure the impact of process changes and predict improvement outcomes.
Statistical analysis helps teams move beyond gut feelings to data-driven decisions. By applying regression methods, organizations can identify critical process inputs and optimize their operations for maximum efficiency.
Measuring Process Performance
Teams use regression analysis to establish baseline performance metrics and track improvements over time. This statistical approach reveals:
- Key process indicators
- Variable relationships
- Performance trends
- Improvement opportunities
Root Cause Analysis Through Regression
Six Sigma practitioners leverage regression analysis to uncover hidden patterns in process data.
The statistical relationships revealed through regression help teams identify true root causes rather than surface-level symptoms.
Quality teams analyze historical data to determine which variables significantly impact process outcomes. This analysis guides improvement efforts by highlighting the most critical areas for intervention.
Defect Prevention Strategies
Regression models enable teams to predict potential defects before they occur.
By understanding the relationships between process inputs and outputs, organizations can implement preventive measures rather than reactive solutions.
Statistical analysis helps quality professionals:
- Monitor critical process parameters
- Detect early warning signs
- Implement corrective actions
- Validate improvement results
Process Optimization Through Prediction with Regression Analysis
Modern Six Sigma projects use regression analysis to optimize processes in real-time.
Statistical models predict process outcomes under different conditions, allowing teams to select the most effective improvement strategies.
Data-Driven Decision Making
Quality teams use regression results to:
- Set process targets
- Adjust control limits
- Optimize operating conditions
- Validate improvements
Integration of Regression Analysis with Six Sigma Tools
Regression analysis works alongside other Six Sigma tools to provide deeper insights.
Teams combine regression results with:
- Control Charts: Monitor process stability
- Design of Experiments: Test improvement ideas
- Capability Analysis: Assess process performance
- FMEA: Identify potential failure modes
Software Integration and Automation
Modern statistical software packages streamline regression analysis in Six Sigma projects.
These tools enable:
- Real-time data analysis
- Automated model building
- Interactive visualizations
- Predictive analytics
Quality teams now focus more on interpreting results and implementing improvements rather than performing manual calculations.
This evolution allows for faster, more accurate decision-making in process improvement projects.
Future Trends in Process Analysis
The integration of machine learning with traditional regression techniques continues to advance. Quality professionals increasingly use automated analysis tools to:
- Process larger datasets
- Identify complex patterns
- Generate predictive models
- Optimize processes continuously
This technological evolution enhances the power of regression analysis in Six Sigma projects while maintaining statistical rigor and reliability.
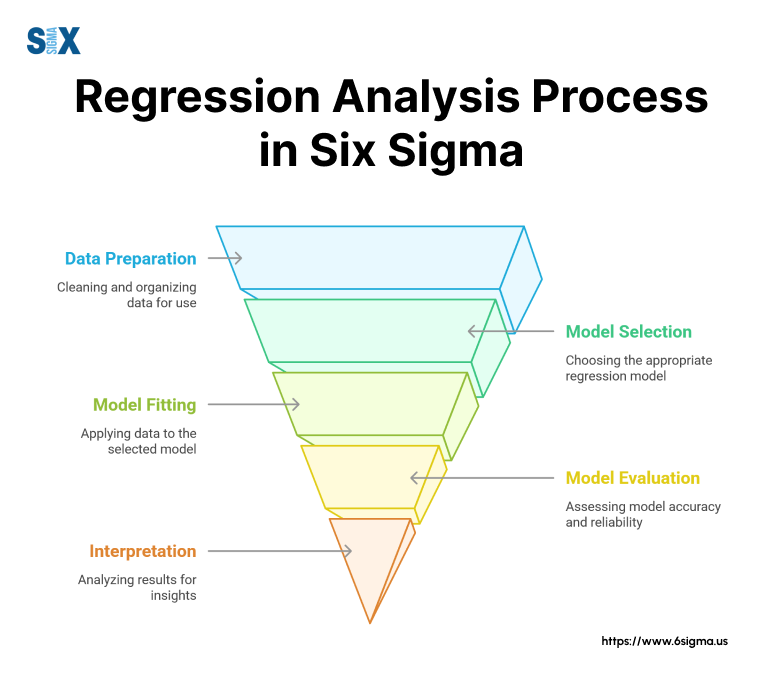
Data Collection and Preparation
Successful regression analysis begins with proper data collection. Quality teams must gather relevant process data that accurately represents the system under study.
The data collection phase requires careful planning to ensure sufficient sample sizes and appropriate measurement techniques.
Data Quality Requirements
Teams should focus on:
- Measurement system accuracy
- Sample size adequacy
- Data consistency
- Variable selection
Raw data requires cleaning and formatting before analysis. This preparation includes removing outliers, handling missing values, and checking for data normality.
Selecting The Right Regression Model
Model selection depends on the process characteristics and project goals. Simple linear regression works well for basic relationships, while complex processes may require multiple regression or nonlinear models.
Model Selection Criteria
Quality professionals evaluate:
- Data type and structure
- Number of variables
- Expected relationships
- Required accuracy levels
The chosen model must align with both statistical requirements and practical constraints of the Six Sigma project.
Performing The Regression Analysis
Modern statistical software simplifies performing regression analysis in Six Sigma projects.
Teams use specialized tools to:
- Input prepared data
- Set analysis parameters
- Generate statistical outputs
- Create visual representations
Analysis Steps
The analysis process follows these key steps:
- Variable definition
- Model specification
- Parameter estimation
- Diagnostic checking
Interpreting Statistical Results
Result interpretation requires both statistical knowledge and process understanding. Quality professionals examine multiple indicators to assess model effectiveness:
- R-squared values measure fit quality
- P-values indicate significance
- Residual plots reveal patterns
- Confidence intervals guide decisions
Key Performance Indicators
Teams evaluate:
- Model accuracy
- Prediction reliability
- Variable significance
- Error patterns
Model Validation Techniques
Validation ensures the regression model accurately represents the process. Quality teams use various methods to verify model reliability:
- Split sample validation
- Cross-validation techniques
- Residual analysis
- Prediction testing
Validation Requirements
The validation process must confirm:
- Model stability
- Prediction accuracy
- Assumption validity
- practical usefulness
Implementation and Monitoring of Regression Analysis
After validation, teams implement the regression model in process improvement efforts. Ongoing monitoring ensures continued model effectiveness through:
- Regular performance checks
- Updated data analysis
- Model refinement
- Result verification
Continuous Improvement
Quality teams should:
- Monitor model performance
- Update analysis as needed
- Refine predictions
- Document improvements
This systematic approach to regression analysis ensures reliable results for Six Sigma projects while maintaining statistical rigor and practical applicability.
Manufacturing Industry Applications
An automotive parts manufacturer utilized regression analysis to optimize their injection molding process.
The quality team analyzed the relationship between temperature settings, pressure levels, and part dimensions.
Through multiple regression analysis, they identified optimal processing conditions that reduced defect rates by 67% and saved $1.2 million annually.
Key Manufacturing Insights
The regression model revealed that pressure variations had twice the impact on part quality compared to temperature fluctuations.
This discovery led to enhanced process controls and automated adjustment systems, resulting in:
- Reduced material waste
- Improved part consistency
- Lower production costs
- Increased throughput
Service Industry Implementation
A major banking institution applied regression analysis to improve customer service response times.
The analysis examined relationships between call volume, staff scheduling, and customer wait times across different time periods.
Service Optimization Results
The regression model identified peak demand patterns and optimal staffing levels. Implementation of the findings resulted in:
- 40% reduction in wait times
- 25% improvement in customer satisfaction
- 15% decrease in operating costs
- Enhanced resource allocation
The bank now uses real-time regression analysis to adjust staffing levels dynamically, maintaining service quality while optimizing resources.
Healthcare Process Improvements
A regional hospital network employed regression analysis to reduce emergency department wait times. The study examined multiple variables including staffing levels, patient arrival patterns, and treatment times.
Healthcare Impact Analysis
The regression model revealed unexpected correlations between seemingly unrelated factors.
Key findings showed that:
- Laboratory processing times significantly impacted overall wait times
- Specific staff combinations yielded optimal patient flow
- Equipment availability patterns affected treatment efficiency
- Weather conditions influenced patient arrival rates
Implementation Results
After implementing changes based on the regression analysis, the hospital network achieved:
- 35% reduction in average wait times
- 28% improvement in patient satisfaction
- 20% increase in department efficiency
- Better resource utilization
Cross-Industry Lessons
These examples demonstrate how regression analysis in Six Sigma projects delivers measurable improvements across different sectors. Common success factors include:
- Data-driven decision making
- Real-time monitoring capabilities
- Automated adjustment systems
- Continuous model refinement
Implementation Strategies
Successful organizations follow these key steps:
- Clear problem definition
- Thorough data collection
- Appropriate model selection
- Rigorous validation
- Continuous monitoring
Future Applications
Modern regression analysis continues to evolve with new technologies. Organizations increasingly integrate:
- Machine learning algorithms
- Real-time data analysis
- Automated optimization
- Predictive maintenance
These advancements enable more sophisticated applications of regression analysis across industries, leading to improved process control and business outcomes.
Popular Software Tools For Six Sigma Analysis
Statistical software plays a crucial role in performing regression analysis within Six Sigma projects. Minitab stands out as an industry standard, offering specialized tools for quality improvement initiatives.
SAS provides enterprise-level capabilities for large-scale projects, while R delivers flexible, open-source solutions for advanced analytics.
Minitab Features
Minitab provides dedicated Six Sigma tools with intuitive interfaces for regression analysis. The software includes:
- Built-in project templates
- Interactive visualization tools
- Automated report generation
- Quality improvement workflows
These features make Minitab particularly suitable for quality professionals focusing on process improvement projects.
Enterprise Solutions: SAS And JMP
SAS offers robust capabilities for organizations requiring enterprise-wide deployment. The platform excels in handling large datasets and complex analyses.
JMP, a SAS product, provides additional visualization capabilities specifically designed for Six Sigma practitioners.
Advanced Analytics Capabilities
Enterprise solutions deliver:
- Scalable processing power
- Advanced modeling options
- Integration capabilities
- Automated workflows
Open-Source Options: R And Python
R programming language offers powerful statistical capabilities with specialized packages for Six Sigma applications.
Python provides similar functionality with additional machine learning capabilities, making both options valuable for advanced users.
Customization Benefits
Open-source tools enable:
- Custom analysis scripts
- Specialized visualizations
- Automated reporting
- Integration flexibility
Selecting The Right Software Tool
Tool selection depends on several key factors affecting project success. Organizations must consider:
- Project scope requirements
- Team technical expertise
- Budget constraints
- Integration needs
Selection Criteria Matrix
Essential considerations include:
- Ease of use
- Analysis capabilities
- Support availability
- Cost structure
- Training requirements
Implementation Considerations
Successful software implementation requires proper planning and support. Organizations should focus on:
- User training programs
- Technical support access
- Data security measures
- Integration requirements
Best Practices For Tool Usage
Quality teams should:
- Standardize analysis procedures
- Document workflows
- Maintain version control
- Regular software updates
Future Software Trends
Statistical software continues evolving with new capabilities. Emerging trends include:
- Cloud-based analytics
- Real-time processing
- AI integration
- Automated optimization
These advancements enhance regression analysis capabilities while simplifying complex statistical procedures for Six Sigma practitioners.
Tool Integration Strategies
Modern quality improvement initiatives often require multiple tools working together. Successful integration strategies focus on:
- Data compatibility
- Workflow automation
- Result validation
- Process standardization
Organizations should plan for future needs while selecting tools that meet current requirements. This forward-thinking approach ensures sustainable success in Six Sigma projects.
Stop struggling with statistical calculations. Master Minitab helping you focus on insights rather than mechanics
Common Data Quality Challenges
Data quality issues frequently derail regression analysis efforts in Six Sigma projects. Missing values, outliers, and measurement system errors can lead to unreliable results.
Quality teams must address these issues before proceeding with analysis to ensure valid conclusions.
Data Collection Problems
Organizations often face challenges with:
- Inconsistent measurement methods
- Insufficient sample sizes
- Biased sampling techniques
- Poor documentation practices
Model Selection Mistakes
Choosing inappropriate regression models leads to misleading results. Teams sometimes force linear models onto nonlinear relationships or overlook important variables.
These errors can mask true process relationships and lead to ineffective improvements.
Prevention Strategies
Quality teams should:
- Validate model assumptions
- Test multiple model types
- Consider variable interactions
- Document selection criteria
Result Interpretation Errors
Misinterpreting regression results can misdirect improvement efforts. Common mistakes include confusing correlation with causation and overlooking statistical significance.
These errors waste resources and potentially harm process performance.
Best Practices For Analysis
Successful teams implement:
- Structured review processes
- Peer validation procedures
- Results documentation
- Implementation testing
Solutions And Implementation Guidelines with Regression Analysis
Organizations can avoid common pitfalls through systematic approaches to regression analysis.
Establishing clear procedures and checkpoints helps ensure reliable results and successful implementations.
Looking Ahead: The Future of Process Improvement
Regression analysis in Six Sigma continues growing with the latest technology.
Machine learning integration and automated analysis tools are reshaping how organizations approach process improvement.
These developments enable more sophisticated analysis while reducing technical barriers.
Emerging Trends
Key developments include:
- Real-time analysis capabilities
- Automated model selection
- Advanced visualization tools
- Predictive analytics integration
Taking Action: Implementation Steps
Organizations ready to enhance their Six Sigma programs should:
- Assess current capabilities
- Identify improvement opportunities
- Develop implementation plans
- Train team members
- Monitor results
Success Factors
Critical elements for successful implementation include:
- Leadership support
- Technical expertise
- Proper tools
- Continuous learning
Final Recommendations
Regression analysis remains a powerful tool for Six Sigma practitioners. Success requires careful attention to data quality, model selection, and result interpretation.
Organizations should invest in proper training and tools while staying current with technological advances.
Transform your organization’s process improvement capabilities. Join our Six Sigma Champion Leadership Program to learn the methodical approach
Next Steps For Implementation
Quality teams should:
- Review current practices
- Update analysis procedures
- Enhance team capabilities
- Monitor industry trends
The future of regression analysis in Six Sigma promises enhanced capabilities through technology integration.
Organizations that adapt to these changes while maintaining statistical rigor will achieve superior results in their process improvement initiatives.
SixSigma.us offers both Live Virtual classes as well as Online Self-Paced training. Most option includes access to the same great Master Black Belt instructors that teach our World Class in-person sessions. Sign-up today!
Virtual Classroom Training Programs Self-Paced Online Training Programs


