Statistical Tools: From Basics to Advanced Analysis
Researchers and analysts extract vital insights from wide and complex datasets with the help of statistical tools and modern data analysis.
To interpret, analyze, and process your data effectively these tools encompass various methods, techniques, and software applications.
Statistical analysis has grown significantly with technological advancements, transforming how organizations can make data-driven decisions.
Key Highlights
- Statistical Methods for Data Collection Analysis
- Software Solutions for Statistical Processing
- Practical Applications Across Different Industries
- Advanced Tools for Complex Data Analysis
- Quality Control Through Statistical Methods
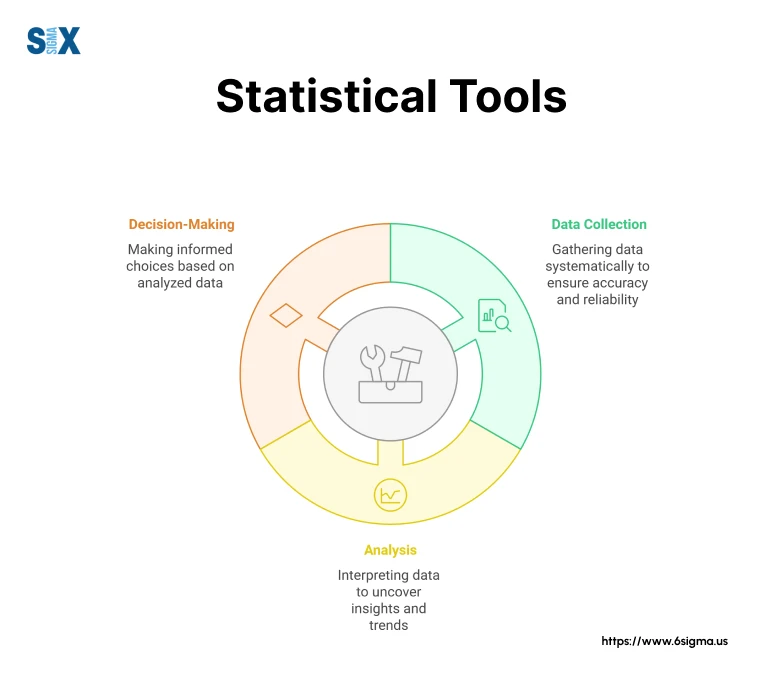
What are Basic Statistical Tools and Concepts?
Statistical tools begin with fundamental concepts that form the foundation of data analysis.
These basic tools help researchers and analysts understand data distribution, central values, and variability within datasets.
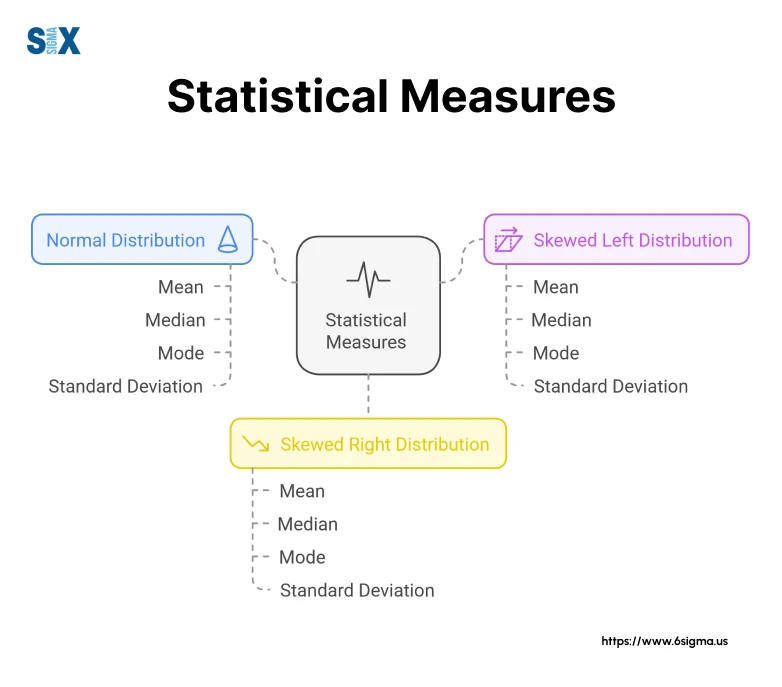
Measures of Central Tendency
The mean represents the arithmetic average of a dataset, calculated by summing all values and dividing by the total number of observations.
This statistical tool proves useful when data follows a normal distribution pattern.
Median values indicate the middle point in an ordered dataset. Unlike the mean, the median remains unaffected by extreme values or outliers, making it a reliable measure for skewed distributions.
For instance, in salary data analysis, the median often provides a more accurate picture than the mean.
Mode represents the most frequently occurring value in a dataset. This measure becomes particularly valuable when analyzing categorical data or discrete numerical values.
Measures of Dispersion
Standard deviation measures how spread out numbers are from their average value. This statistical tool helps researchers understand data variability and consistency.
Quality control departments use standard deviation to monitor product specifications and manufacturing processes a practice central to methodologies taught in Six Sigma certification programs.
Variance, the square of standard deviation, provides another perspective on data spread.
While less intuitive than standard deviation, variance plays a crucial role in advanced statistical analyses and hypothesis testing.
Range offers a simple measure of spread, calculated as the difference between the highest and lowest values.
Though basic, this statistical tool provides quick insights into data variability. Environmental scientists often use range to describe temperature fluctuations or rainfall patterns.
Probability Distributions
Normal distribution, often called the bell curve, serves as a fundamental statistical tool in data analysis.
Many natural phenomena follow this pattern, making it essential for prediction and inference. Height distributions in populations or test scores often exhibit normal distribution patterns.
Binomial distribution describes the probability of success-failure outcomes in a fixed number of trials.
Poisson distribution helps analyze rare events occurring in fixed time intervals. This statistical tool finds applications in queue management, traffic flow analysis, and customer service optimization.
Applications of Descriptive Statistical Tools
Business analysts apply these statistical tools to summarize large datasets and identify trends.
For example, retail companies analyze sales data using measures of central tendency to understand average customer spending patterns.
Research institutions combine different statistical tools to validate their findings.
Educational institutions employ these tools to evaluate student performance.
These basic statistical tools provide the groundwork for more advanced analyses.
Learn how to interpret data patterns and make informed decisions using Minitab. Start your statistical journey today!
Common Statistical Tools and Methods for Data Analysis
Statistical tools vary in complexity and application, each serving specific analytical purposes.
These methods help researchers test hypotheses, compare groups, and identify relationships within data sets.
T-Test: Comparing Group Means
The t-test serves as a fundamental statistical tool for comparing means between two groups.
This method determines whether observed differences occur by chance or represent genuine variations between populations.
Independent t-tests analyze data from separate groups, such as comparing test scores between two different classes.
Paired t-tests examine before-and-after scenarios, like measuring the effectiveness of a training program on employee performance.
The t-test’s reliability depends on several assumptions, including normal distribution and equal variances.
ANOVA: Analyzing Multiple Groups
Analysis of Variance (ANOVA) extends beyond t-tests by comparing means across multiple groups simultaneously.
This statistical tool helps researchers avoid the increased error risk associated with multiple t-tests.
One-way ANOVA examines the effect of a single factor on a dependent variable.
For example, marketing researchers might use this method to compare customer satisfaction across different product lines.
Two-way ANOVA investigates the effects of two independent variables and their interaction.
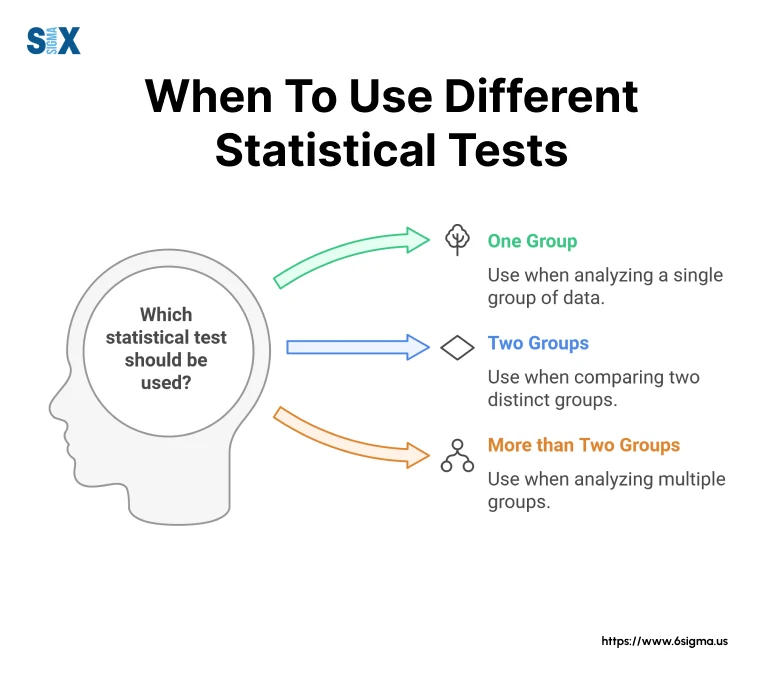
Regression Analysis: Understanding Relationships
Linear regression explores relationships between variables, predicting outcomes based on one or more predictors.
This statistical tool finds widespread use in forecasting and trend analysis.
Multiple regression incorporates several independent variables to explain variations in the dependent variable.
Business analysts use this method to understand factors affecting sales performance or customer behavior.
Logistic regression analyzes binary outcomes, making it valuable for risk assessment and classification problems.
Chi-Square Test: Analyzing Categorical Data
Chi-square tests examine relationships between categorical variables, determining whether observed patterns differ significantly from expected frequencies.
Market researchers use this statistical tool to analyze consumer preferences across different demographics.
The goodness-of-fit test compares observed data with theoretical distributions. Quality control departments employ this method to verify whether production outputs meet expected specifications.
Tests of independence evaluate relationships between categorical variables, helping researchers understand associations in survey data or experimental results.
Factor Analysis: Identifying Underlying Patterns
Factor analysis reduces complex datasets by identifying underlying variables that explain observed patterns.
This statistical tool proves valuable in questionnaire development and psychological research.
Exploratory factor analysis uncovers hidden structures within data without predetermined expectations.
Confirmatory factor analysis tests whether data fits a hypothesized model. Educational researchers employ this tool to validate assessment instruments and measurement scales.
Selecting Appropriate Statistical Methods
The choice of statistical tools depends on research objectives, data types, and underlying assumptions.
Researchers must consider sample size, distribution patterns, and measurement scales when selecting analysis methods.
Statistical analysis software packages offer various tools for different analytical needs.
These programs help automate calculations while providing diagnostic measures to verify assumption compliance.
Understanding these common statistical tools enables researchers to design effective studies and draw valid conclusions from their data.
From Pareto charts to time series plots, learn to create powerful visual insights.
Advanced Statistical Tools and Techniques
Modern data analysis requires sophisticated statistical tools to handle complex datasets and extract meaningful insights.
These advanced techniques build upon fundamental statistical methods to address specialized analytical needs.
Machine Learning in Statistical Analysis
Machine learning algorithms represent powerful statistical tools that identify patterns and make predictions from large datasets.
These methods excel at handling non-linear relationships and complex interactions that traditional statistical approaches might miss.
Supervised learning algorithms analyze labeled data to create predictive models.
Unsupervised learning methods discover hidden patterns without predetermined outcomes.
Retail businesses employ these techniques to segment customers and personalize marketing strategies based on purchasing behaviors.
Neural networks process complex data structures through interconnected layers.
These statistical tools excel at image recognition, natural language processing, and other pattern recognition tasks where traditional methods fall short.
Time Series Analysis Methods
Time series analysis examines data points collected over time to identify trends, seasonal patterns, and cyclical variations.
These statistical tools help organizations forecast future values and understand temporal relationships.
ARIMA models combine autoregression, integration, and moving averages to analyze time-dependent data.
Economic analysts use these tools to forecast market trends and economic indicators.
Exponential smoothing techniques weight recent observations more heavily than older ones. Supply chain managers apply these statistical tools to optimize inventory levels and predict demand patterns.
Seasonal decomposition separates time series data into trend, seasonal, and residual components. Weather forecasters utilize these methods to analyze climate patterns and predict weather conditions.
Bayesian Statistical Methods
Bayesian statistics incorporates prior knowledge and updates probabilities as new data becomes available.
These statistical tools prove particularly valuable when dealing with uncertainty and limited data.
Hierarchical Bayesian models handle complex nested data structures. Medical researchers use these techniques to analyze clinical trial data and evaluate treatment effectiveness across different patient subgroups.
Bayesian networks model probabilistic relationships between variables.
Markov Chain Monte Carlo methods simulate complex probability distributions. These techniques help solve problems in physics, engineering, and financial modeling where analytical solutions prove difficult.
Integration of Advanced Statistical Tools
Modern statistical software packages integrate these advanced techniques with user-friendly interfaces.
This integration enables researchers and analysts to apply sophisticated methods without extensive programming knowledge.
Cloud computing platforms provide scalable resources for implementing advanced statistical tools. These platforms allow organizations to process large datasets and run complex analyses efficiently.
Real-time analytics combine multiple statistical techniques to process streaming data. Organizations use these tools to monitor operations, detect anomalies, and respond to changing conditions quickly.
Popular Statistical Software Tools for Data Analysis
Statistical software packages provide essential platforms for data analysis and research.
These tools offer varying capabilities, from basic statistical calculations to advanced analytical procedures.
SPSS: Statistical Package for Social Sciences
SPSS stands out as a preferred statistical tool among social science researchers and business analysts. The software features an intuitive interface that combines point-and-click functionality with advanced statistical capabilities.
The data editor in SPSS enables efficient handling of large datasets. Researchers can easily clean, transform, and prepare data for analysis without extensive programming knowledge.
SPSS output viewer presents results in organized tables and graphs. This feature helps researchers document their findings and create professional reports for publication or presentation.
R Programming Environment
R provides a powerful open-source platform for statistical analysis.
This statistical tool offers extensive customization options through thousands of specialized packages created by the research community.
The ggplot2 package in R creates publication-quality graphics. Researchers use these visualization capabilities to communicate complex findings effectively through customizable charts and plots.
RStudio enhances the R experience with an integrated development environment. This interface makes R more accessible to beginners while maintaining advanced functionality for experienced users.
Python for Statistical Analysis
Python has emerged as a versatile statistical tool, particularly through libraries like NumPy and SciPy. These packages provide robust capabilities for numerical computing and scientific analysis.
Pandas library excels at data manipulation and analysis. Analysts use this tool to handle structured data and perform statistical operations efficiently.
Scikit-learn implements machine learning algorithms for statistical analysis. This library enables researchers to build predictive models and perform advanced statistical procedures.
SAS: Statistical Analysis System
SAS delivers enterprise-level statistical tools for large-scale data analysis.
Organizations rely on SAS for its stability and ability to handle massive datasets efficiently.
The SAS Enterprise Guide provides a graphical interface for statistical analysis. This feature makes advanced analytics accessible to users with varying technical backgrounds.
SAS Visual Analytics creates interactive dashboards and reports. Business analysts use these capabilities to communicate insights effectively across organizations.
Stata Statistical Software
Stata combines statistical analysis with data management capabilities. This tool proves particularly popular in economics, biostatistics, and epidemiology research.
The command-line interface offers precise control over analytical procedures. Researchers appreciate this feature for reproducing analyses and documenting methodologies.
Stata’s graphics editor produces customizable visualizations. These tools help researchers create publication-ready figures and presentations.
Choosing the Right Statistical Software
Budget considerations often influence software selection.
While R and Python offer free solutions, commercial packages like SPSS and SAS require significant investment.
Learning curves vary among statistical tools. SPSS provides an easier entry point for beginners, while R and Python demand more initial learning investment.
Industry standards play a role in software selection. Healthcare researchers often use SAS, while social scientists frequently opt for SPSS or Stata.
Integration and Compatibility
Modern statistical tools offer data import/export capabilities. This feature enables researchers to work with various file formats and share data across platforms.
Cloud integration expands accessibility and collaboration. Teams can share analyses and results through connected platforms and services.
Statistical software selection depends on specific research needs, technical requirements, and resource availability. Understanding these tools’ strengths helps researchers choose appropriate solutions for their analytical needs.
Selecting the Right Statistical Tools for Analysis
The selection of appropriate statistical tools significantly impacts research outcomes and data interpretation.
A systematic approach to tool selection ensures reliable results and meaningful conclusions.
Key Factors in Statistical Tool Selection
Data type forms the primary consideration when choosing statistical tools. Categorical data requires different analytical approaches than continuous data, while time series data demands specialized statistical methods.
Sample size influences the reliability of various statistical tools. Large datasets support more sophisticated analyses, while smaller samples might require non-parametric methods for valid results.
Data Distribution Considerations with these Statistical Tools
Normal distribution assumptions underlie many statistical tools. Researchers must verify these assumptions before applying parametric tests to ensure valid results.
Skewed data requires specific statistical approaches. Non-parametric tools often provide more reliable results when data doesn’t follow normal distribution patterns.
Missing data patterns affect tool selection. Some statistical tools handle incomplete datasets better than others, influencing the choice of analytical methods.
Research Design Requirements
Experimental designs need different statistical tools than observational studies. The research methodology determines which analytical approaches will yield valid results.
Cross-sectional studies often employ different tools than longitudinal research. Time-based factors influence the selection of appropriate statistical measures.
Comparative analyses require specific statistical approaches. The number of groups and comparison types guide the selection of appropriate analytical tools.
Technical and Practical Constraints of these Statistical Tools
Resource availability affects statistical tool selection. Budget limitations, software access, and technical expertise influence which tools researchers can effectively utilize.
Time constraints impact analytical choices. Some statistical tools require more extensive data preparation or computational resources than others.
Reporting requirements influence tool selection. Different audiences and publication venues may prefer certain statistical approaches over others.
Implementation Strategy
Pilot testing validates tool selection. Initial analyses with subset data help confirm the appropriateness of chosen statistical methods.
Documentation requirements influence tool choice. Some statistical tools provide better output formatting and result documentation than others.
Replication needs affect selection decisions. Researchers should consider whether chosen tools support reproducible analyses and clear methodology documentation.
Quality Assurance in Tool Selection
Peer review input helps validate tool selection. Consulting with experienced researchers can confirm the appropriateness of chosen statistical methods.
Literature review guides analytical choices. Previous similar studies often provide insights into effective statistical approaches for specific research questions.
Expert consultation supports decision-making. Statistical consultants can help verify tool selection and suggest alternative approaches when needed.
The selection process requires careful consideration of multiple factors to ensure appropriate statistical analysis. Researchers must balance theoretical requirements with practical constraints while maintaining analytical rigor.
Applications of Statistical Tools Across Industries
Statistical tools drive decision-making processes across various sectors, from academic research to business operations.
These applications demonstrate the versatility and importance of statistical analysis in modern organizations.
Statistical Tools in Research Settings
Academic researchers employ statistical tools to validate hypotheses and analyze experimental data.
The peer review process relies heavily on statistical significance to verify research findings and establish scientific credibility.
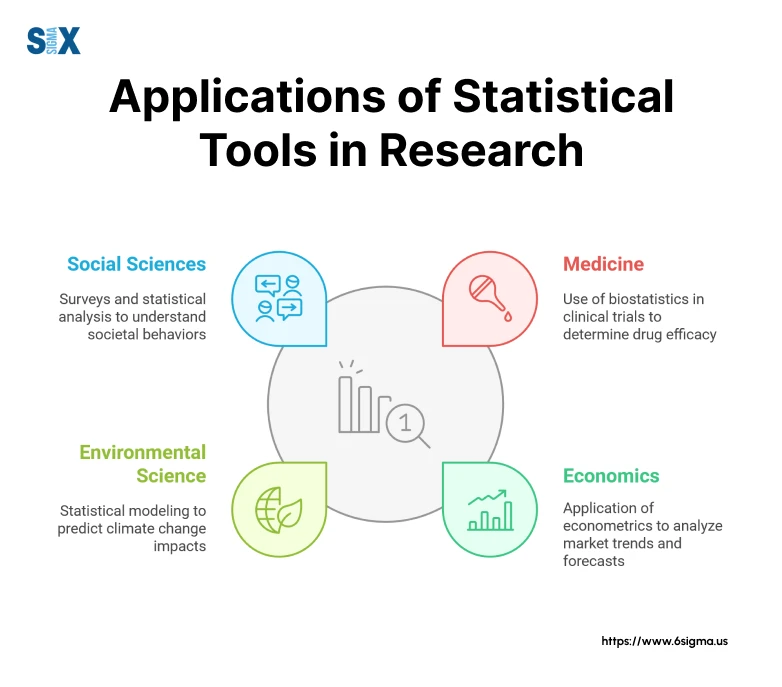
Medical research utilizes statistical tools to evaluate treatment effectiveness. Clinical trials depend on robust statistical analysis to determine drug efficacy and identify potential side effects.
For example, randomized controlled trials use statistical methods to compare treatment outcomes between patient groups.
Social science research applies statistical tools to understand human behavior patterns.
Survey analysis and demographic studies rely on statistical methods to draw meaningful conclusions from large population samples.
Business Applications of Statistical Tools
Quality control departments implement statistical tools to maintain product standards.
Six Sigma methodologies use statistical analysis to reduce defects and optimize manufacturing processes. Manufacturing plants often employ control charts to monitor production quality in real-time.
Market research teams utilize statistical tools to analyze consumer behavior.
Regression analysis helps predict sales trends, while cluster analysis segments customers for targeted marketing campaigns.
Retail businesses analyze purchase patterns using statistical methods to optimize inventory management.
Professionals with Six Sigma certification apply methodologies that use statistical analysis to reduce defects and optimize manufacturing processes.
Statistical Tools in Data Science
Data scientists leverage statistical tools to extract insights from big data. Machine learning algorithms combine statistical methods with computational power to identify patterns and make predictions.
Predictive modeling uses statistical tools to forecast future trends. Weather forecasting systems combine historical data analysis with statistical models to predict weather patterns.
E-commerce platforms use similar approaches to predict customer behavior and recommend products.
Natural language processing applications rely on statistical tools to analyze text data. Sentiment analysis uses statistical methods to evaluate customer feedback and social media content.
Industry-Specific Applications
Healthcare organizations use statistical tools for patient outcome analysis. Hospitals track treatment success rates and identify risk factors through statistical analysis of patient data.
Educational institutions employ statistical tools to assess student performance. Universities analyze admission data and academic outcomes to improve educational programs and support services.
Government agencies utilize statistical tools for policy analysis. Census data processing requires sophisticated statistical methods to draw population insights and allocate resources effectively.
Statistical Tools in Process Improvement
Lean Six Sigma projects rely heavily on statistical tools for process optimization. Organizations use these methods to identify bottlenecks and implement efficiency improvements.
Statistical process control monitors manufacturing operations. Production facilities use real-time statistical analysis to maintain quality standards and reduce waste.
Performance measurement systems incorporate statistical tools to track organizational metrics. Companies analyze key performance indicators using statistical methods to evaluate business success.
Integration with Business Intelligence
Modern business intelligence platforms integrate various statistical tools. Dashboard systems present statistical analyses in user-friendly formats for decision-makers.
Real-time analytics combine multiple statistical methods to process streaming data. Organizations monitor operations and respond to changes using statistical analysis of live data feeds.
Automated reporting systems utilize statistical tools to generate insights. Regular business reports incorporate statistical analysis to track progress and identify trends.
The application of statistical tools continues to evolve with technological advancement. Organizations increasingly rely on statistical analysis to maintain competitive advantages and improve operational efficiency.
Join thousands of professionals who have mastered data interpretation through our industry-recognized certification
Step-by-Step Guide to Basic Statistical Analysis
Statistical analysis follows a structured approach to ensure accurate results and valid conclusions.
This tutorial demonstrates the essential steps using common statistical tools to analyze a dataset effectively.
Data Preparation and Cleaning
The first phase involves organizing raw data into a suitable format for analysis. Researchers must identify and handle missing values, remove duplicates, and correct obvious errors in the dataset.
Data coding transforms qualitative information into numerical values. For example, converting categorical responses like “Yes/No” into binary codes (1/0) prepares the data for statistical analysis.
Exploratory Data Analysis with Statistical Tools
Initial data visualization helps identify patterns and potential outliers. Simple graphs and charts reveal the distribution of variables and highlight unusual observations that require further investigation.
Descriptive statistics provide numerical summaries of the data. Calculating means, medians, and standard deviations offers initial insights into data characteristics and variability.
Testing Statistical Assumptions
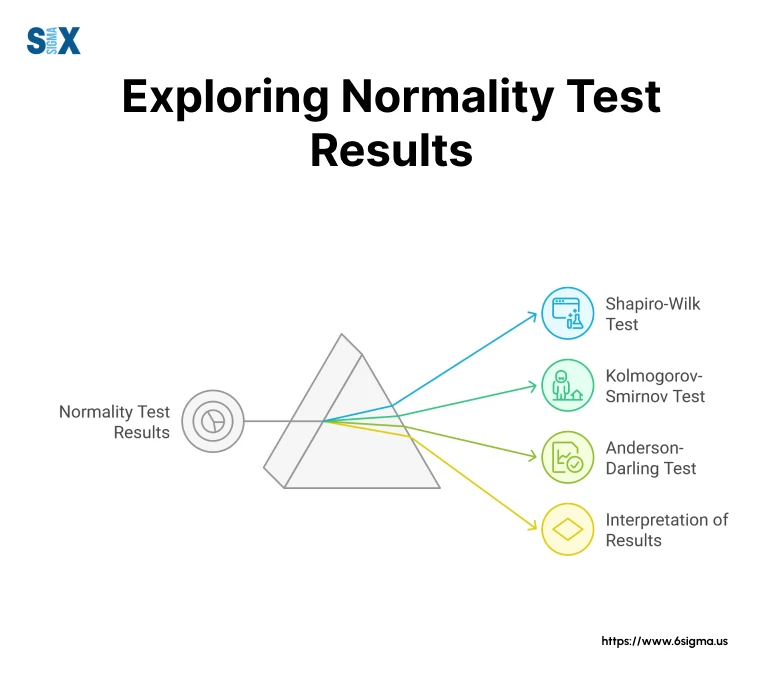
Normality tests determine whether data follows a normal distribution. This crucial step guides the selection of appropriate statistical tools for further analysis.
Homogeneity of variance tests assess whether different groups have similar variability. This assumption influences the choice between parametric and non-parametric statistical methods.
Selecting Appropriate Statistical Tests
Research questions guide the selection of specific statistical tools. Different analytical objectives require different statistical approaches, from simple t-tests to complex multivariate analyses.
Sample size considerations influence test selection. Smaller samples might require non-parametric alternatives to traditional statistical tools.
Performing Statistical Analysis
Statistical software setup requires proper data import and variable specification. Correct labeling and measurement scales ensure accurate analysis and interpretation.
Test execution follows standardized procedures. Running the selected statistical tools generates results tables and significance values for interpretation.
Interpreting Results of Statistical Tools
P-value assessment determines statistical significance. These values help researchers decide whether to reject or fail to reject null hypotheses.
Effect size calculations quantify the magnitude of relationships or differences. This step provides context for the practical significance of statistical findings.
Creating Visual Representations
Results visualization enhances understanding and communication. Graphs and charts effectively convey statistical findings to diverse audiences.
Format selection depends on data types and analytical goals. Different visualization tools suit different types of statistical results and target audiences.
Documenting Analysis Process with Statistical Tools
Methodology documentation ensures reproducibility. Detailed records of statistical procedures enable others to verify and replicate the analysis.
Results reporting follows standard formats. Professional presentation of statistical findings includes appropriate tables, figures, and explanatory text.
Validating Conclusions
Cross-validation techniques verify analytical findings. Additional statistical tools can confirm initial results and strengthen conclusions.
Sensitivity analysis tests result robustness. Different analytical approaches should yield consistent findings for reliable conclusions.
Common Pitfalls to Avoid
Over-interpretation of results leads to invalid conclusions. Statistical significance does not always indicate practical importance.
Multiple testing problems require appropriate corrections. Statistical tools like Bonferroni adjustment help maintain appropriate significance levels.
This structured approach to statistical analysis ensures reliable results and valid interpretations. Following these steps helps researchers avoid common errors and produce trustworthy findings.
Trends in Statistical Tools and Analysis
Statistical tools continue to evolve with technological advancements, offering new capabilities for data analysis.
Big Data Analytics Revolution
Modern statistical tools now handle massive datasets efficiently. Traditional statistical methods have adapted to process terabytes of information, enabling deeper insights from complex data structures.
Real-time analytics platforms integrate statistical tools with streaming data. Organizations monitor operations continuously, using statistical methods to detect patterns and anomalies instantly.
AI Integration in Statistical Analysis
Machine learning algorithms enhance traditional statistical tools. These innovations automate pattern recognition and predictive modeling, reducing manual analysis time.
Neural networks extend classical statistical methods. Deep learning approaches handle complex non-linear relationships that traditional statistical tools struggle to identify.
Cloud-Based Statistical Solutions
Software-as-a-Service platforms deliver statistical tools online. Cloud-based solutions provide access to advanced statistical capabilities without substantial infrastructure investment.
Enhanced Visualization Capabilities of Statistical Tools
Interactive dashboards present statistical results dynamically. Modern tools allow users to explore data relationships through intuitive visual interfaces.
Three-dimensional visualization techniques reveal complex patterns. Advanced statistical tools represent multidimensional relationships in accessible formats.
Automated Statistical Analysis
Smart statistical assistants guide analysis choices. These tools recommend appropriate statistical methods based on data characteristics and research objectives.
Future Developments of Statistical Tools
Quantum computing promises enhanced statistical capabilities. Future statistical tools may leverage quantum systems for complex calculations.
Augmented reality interfaces will visualize statistical results. New presentation methods will make statistical findings more intuitive and accessible.
Blockchain technology may ensure analysis transparency. Statistical tools could use distributed ledgers to maintain verifiable analytical records.
These trends reshape how organizations approach statistical analysis. Modern statistical tools combine traditional methods with new technologies to meet evolving analytical needs.
The Future of Statistical Tools in Data Analysis
Statistical tools remain fundamental to modern research and business operations.
Their evolution continues to shape how organizations analyze data and make decisions across various sectors.
Impact of Statistical Tools Across Fields
These tools enable researchers to process larger datasets and uncover subtle patterns that drive scientific discovery.
Business analytics depend on statistical tools to transform raw data into actionable insights.
The analysis of medical data helps identify treatment effectiveness and optimize clinical protocols for better outcomes.
Advancing Statistical Methodologies
Integration with artificial intelligence enhances traditional statistical approaches. This combination creates more powerful analytical capabilities while maintaining statistical rigor and validity.
Cloud computing platforms make advanced statistical tools more accessible. Organizations of all sizes now access sophisticated analytical capabilities without significant infrastructure investments.
Future Directions in Statistical Analysis
Automated analysis systems will streamline statistical procedures. These developments will help researchers focus on interpretation rather than computational tasks.
Real-time analytics will become standard practice across industries. Statistical tools will process continuous data streams, providing immediate insights for decision-making.
Preparing for Future Developments
Educational programs must evolve to address new statistical capabilities. Training in modern statistical tools becomes essential for professionals across disciplines.
Professional development in statistical analysis remains crucial. Ongoing learning helps practitioners stay current with evolving statistical tools and methods.
Statistical tools will continue to play a vital role in advancing knowledge and improving decision-making processes. Their evolution reflects the growing importance of data-driven approaches across all sectors of society.
Frequently Asked Questions
A. The five most commonly used statistical tools include:
– Descriptive Statistics (mean, median, mode)
– Regression Analysis
– T-tests for comparing means
– ANOVA (Analysis of Variance)
– Chi-Square Tests for categorical data
A. Statistical tools fall into four main categories:
1. Descriptive Tools – Summarize data characteristics
2. Inferential Tools – Draw conclusions from samples
3. Predictive Tools – Forecast future trends
4. Diagnostic Tools – Identify relationships and patterns
A. The fundamental methods of statistical analysis include:
1. Mean and Standard Deviation
2 .Correlation Analysis
3. Hypothesis Testing
4. Factor Analysis
5. Time Series Analysis
A. The best statistical tool depends on specific research needs. SPSS suits social sciences research, R provides flexibility for custom analysis, and Python excels in data science applications. Each tool offers unique advantages for different analytical requirements.
A. The t-test compares means between two groups to determine if they differ significantly. It helps researchers decide whether observed differences occur by chance or represent genuine variations between populations.
A. Statistics finds major applications in:
1. Business Decision Making
2. Scientific Research
3. Healthcare Analysis
4. Quality Control
5. Market Research
6. Economic Planning
Quality control methodologies, such as those mastered through Six Sigma certification, are essential for reducing industrial defects.
A. A survey serves as a data collection method rather than a statistical tool. However, surveys provide data that statistical tools analyze to draw meaningful conclusions and insights.
A. The four primary statistical models include:
1. Linear Regression Models
2. Logistic Regression Models
3. Time Series Models
4. Survival Analysis Models
A. Statistical Process Control employs seven key tools:
1. Control Charts
2. Pareto Charts
3. Cause-and-Effect Diagrams
4. Check Sheets
5. Histograms
6. Scatter Diagrams
7. Flow Charts
SixSigma.us offers both Live Virtual classes as well as Online Self-Paced training. Most option includes access to the same great Master Black Belt instructors that teach our World Class in-person sessions. Sign-up today!
Virtual Classroom Training Programs Self-Paced Online Training Programs


