Understanding Multimodal Distribution: A Comprehensive Guide
In statistics, a multimodal distribution represents a probability distribution with multiple peaks or modes in its data pattern.
These distributions occur when data points cluster around several different values, creating distinct peaks in the graphical representation.
Unlike simpler distributions with a single peak, multimodal distributions reveal complex patterns that often indicate underlying subgroups or distinct phenomena within the data.
What This Guide Covers
- Statistical properties and characteristics
- Visual interpretation methods
- Real-world applications
- Analysis techniques
What Is A Multimodal Distribution?
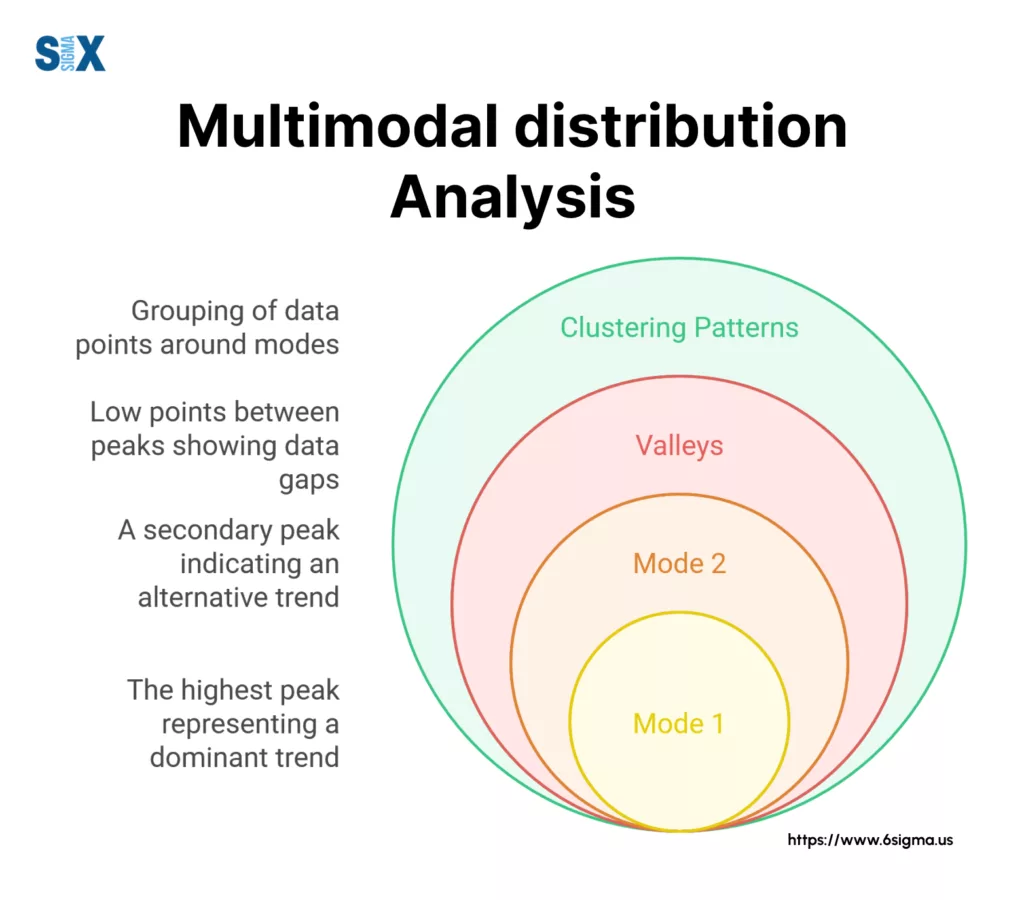
A multimodal distribution occurs when data points cluster around multiple distinct values, creating several peaks in the distribution curve.
These peaks, known as modes, represent the most frequently occurring values within different segments of the data.
Each mode typically indicates a separate subgroup or underlying pattern within the dataset.
Key Features of Multimodal Distributions
The shape of a multimodal distribution varies based on the number and position of its modes.
These distributions often display valleys between peaks, where data points occur less frequently.
The height of each peak can differ, suggesting varying concentrations of data points around different values.
For example, when measuring the heights of plants in a mixed-species garden, taller species might create one peak while shorter species form another.
Bimodal vs Multimodal Patterns
Bimodal distributions represent a specific type of multimodal distribution with exactly two peaks.
These appear frequently in natural phenomena, such as the daily patterns of traffic flow with morning and evening rush hours.
While bimodal distributions always show two distinct peaks, general multimodal distributions can exhibit three or more peaks, reflecting more complex data patterns.
The identification of multimodal distributions proves crucial in statistical analysis.
When data follows a multimodal pattern, traditional statistical measures like mean and median might not effectively represent the central tendency of the data.
Instead, analysts must consider each mode separately to understand the underlying data structure and make accurate interpretations.
Visual Representation of Multimodal Distributions
Statistical visualization tools help reveal the underlying patterns in multimodal distributions.
These visual methods highlight distinct peaks, valleys, and overall data patterns that might remain hidden in numerical summaries alone.
Histograms in Multimodal Distribution Analysis
Histograms serve as fundamental tools for displaying multimodal distributions by grouping data into bins and showing frequency counts.
The resulting graph clearly displays multiple peaks when present in the data.
For instance, a histogram of employee ages in a company might show distinct peaks around entry-level workers (25-30 years) and senior staff (45-50 years).
Density Plots And Kernel Estimation
Density plots offer a smoother representation of multimodal distributions compared to histograms.
These plots use kernel density estimation to create continuous curves that highlight the data’s underlying structure.
The smoothing parameter in kernel estimation affects how clearly the multiple modes appear in the final visualization.
Alternative Graphical Methods
Box plots and violin plots provide additional insights into multimodal data structures
Violin plots combine box plot features with density curves, showing both the data distribution and summary statistics. These plots excel at revealing asymmetry and multiple modes in the data distribution.
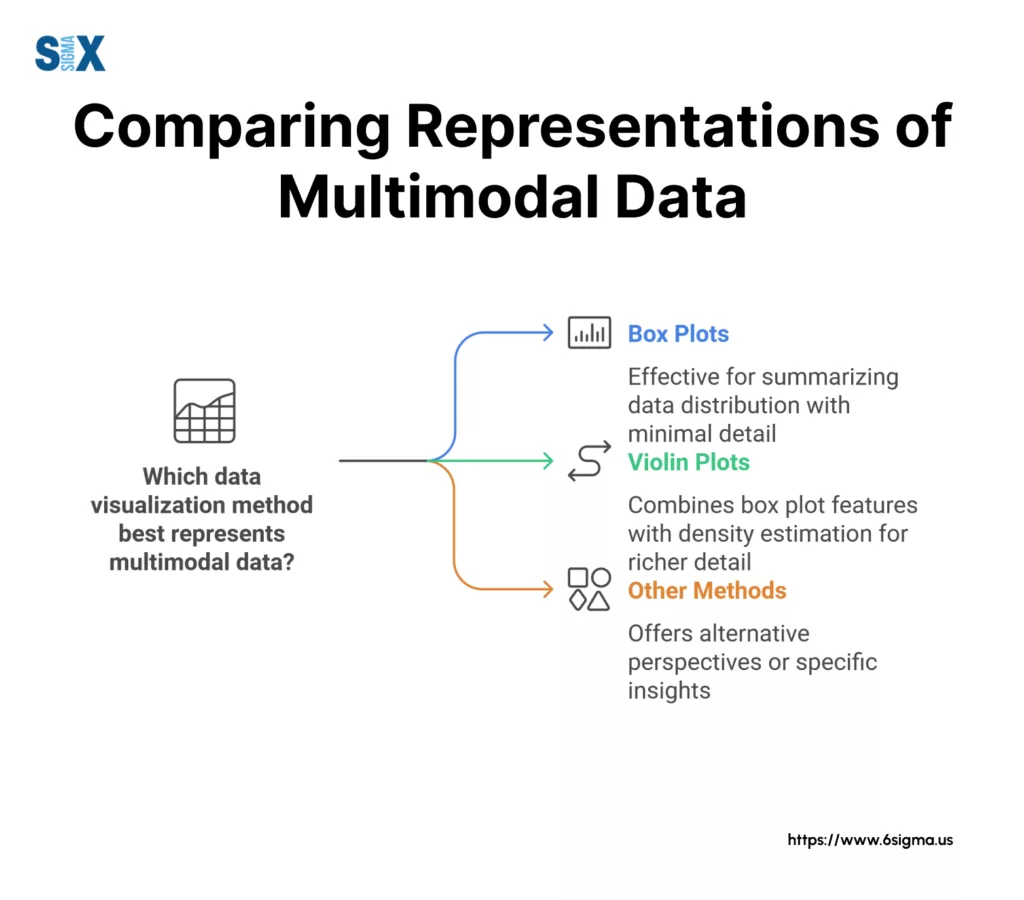
The choice of visualization method depends on the specific aspects of the multimodal distribution you need to emphasize.
Histograms work well for counting distinct groups, while density plots better illustrate continuous distributions.
Violin plots prove particularly useful when comparing multiple groups or variables simultaneously.
Master the art of statistical visualization and graphical analysis with our comprehensive course
Types of Multimodal Distributions
Multimodal distributions appear in various forms, each characterized by the number and arrangement of their peaks.
These different types reflect specific patterns in data that often signal distinct underlying processes or populations.
Bimodal Distributions
The most common type of multimodal distribution is the bimodal distribution, featuring two distinct peaks.
These often emerge in natural phenomena, such as the daily temperature patterns in desert regions, where temperatures peak during mid-day and drop significantly at night.
Bimodal distributions frequently indicate the presence of two separate subgroups within a population.
Trimodal Distributions
Trimodal distributions display three distinct peaks, indicating three separate clusters or processes in the data.
For example, measurements of fish lengths in a lake might show three peaks corresponding to different age groups of the same species.
These distributions often appear in biological and ecological studies where multiple life stages or groups exist simultaneously.
Complex Multimodal Distribution Patterns
Some distributions exhibit more than three modes, creating complex patterns that require careful analysis.
These patterns might appear in social science research, where survey responses cluster around several distinct opinions or preferences.
The interpretation of such distributions demands consideration of multiple factors that could influence the data’s structure.
Each type of multimodal distribution provides unique insights into the underlying data structure and requires specific analytical approaches.
Understanding these variations helps researchers and analysts choose appropriate statistical methods and make accurate interpretations of their findings.
Causes of Multimodal Distribution
Several factors can lead to the formation of multimodal distributions in datasets.
Understanding these causes helps analysts interpret data patterns and make informed decisions about statistical analysis methods.
Mixed Populations And Subgroups
When data comes from distinct populations or subgroups, multimodal distributions often emerge.
For example, height measurements in a mixed-gender study naturally form two peaks, reflecting the different average heights of males and females.
Similarly, age distributions in universities often show peaks for undergraduate students, graduate students, and faculty members.
Natural Phenomena And Processes due to Multimodal Distribution
Some multimodal distributions arise from underlying natural processes.
Daily traffic patterns typically show two peaks corresponding to morning and evening rush hours.
In wildlife studies, measurements of animal activity might peak during dawn and dusk for species that are most active during twilight hours.
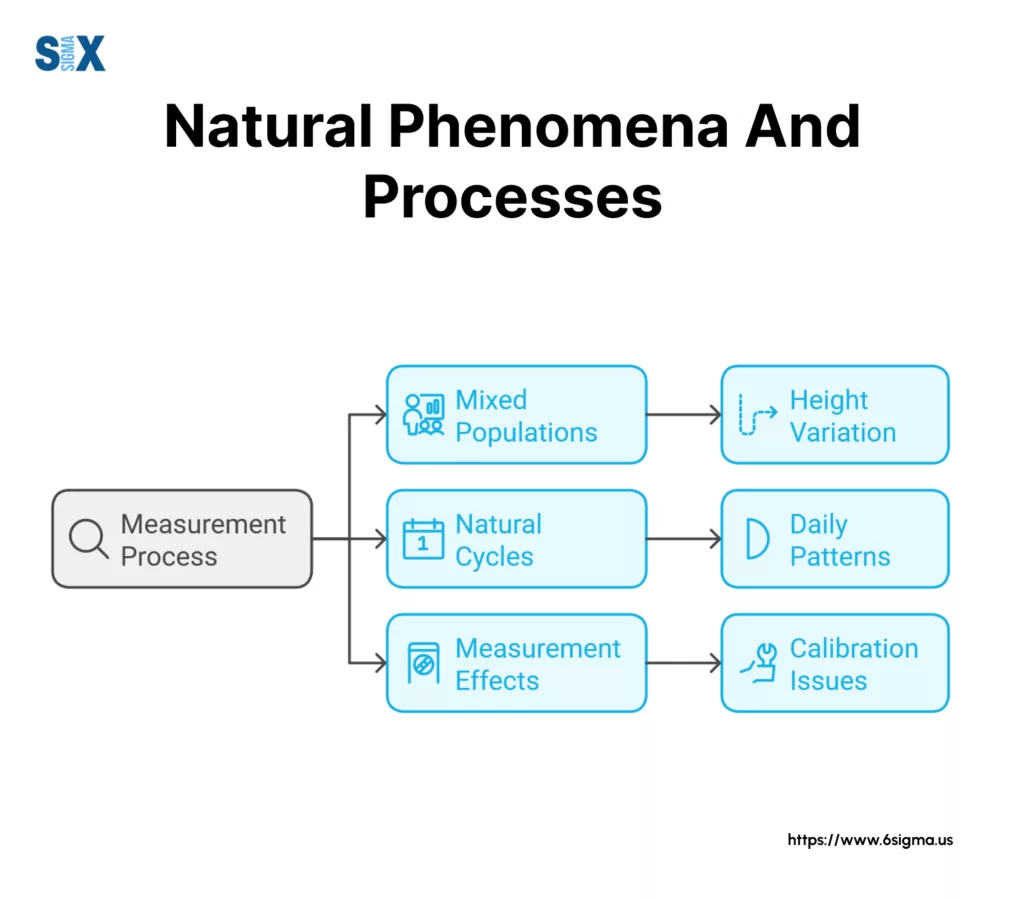
Measurement And Collection Effects
Technical factors in data collection can create multimodal distributions. Instrument calibration issues might cause readings to cluster around specific values.
Rounding practices in data recording can also generate artificial peaks in the distribution.
For instance, when people report their height, they tend to round to the nearest half or whole inch, creating multiple modes in the data.
These various causes of multimodal patterns highlight why data scientists must carefully examine the origin of their data before applying statistical methods.
Recognition of the underlying cause helps determine appropriate analytical approaches and prevents misinterpretation of results.
Analyzing Multimodal Distribution Data
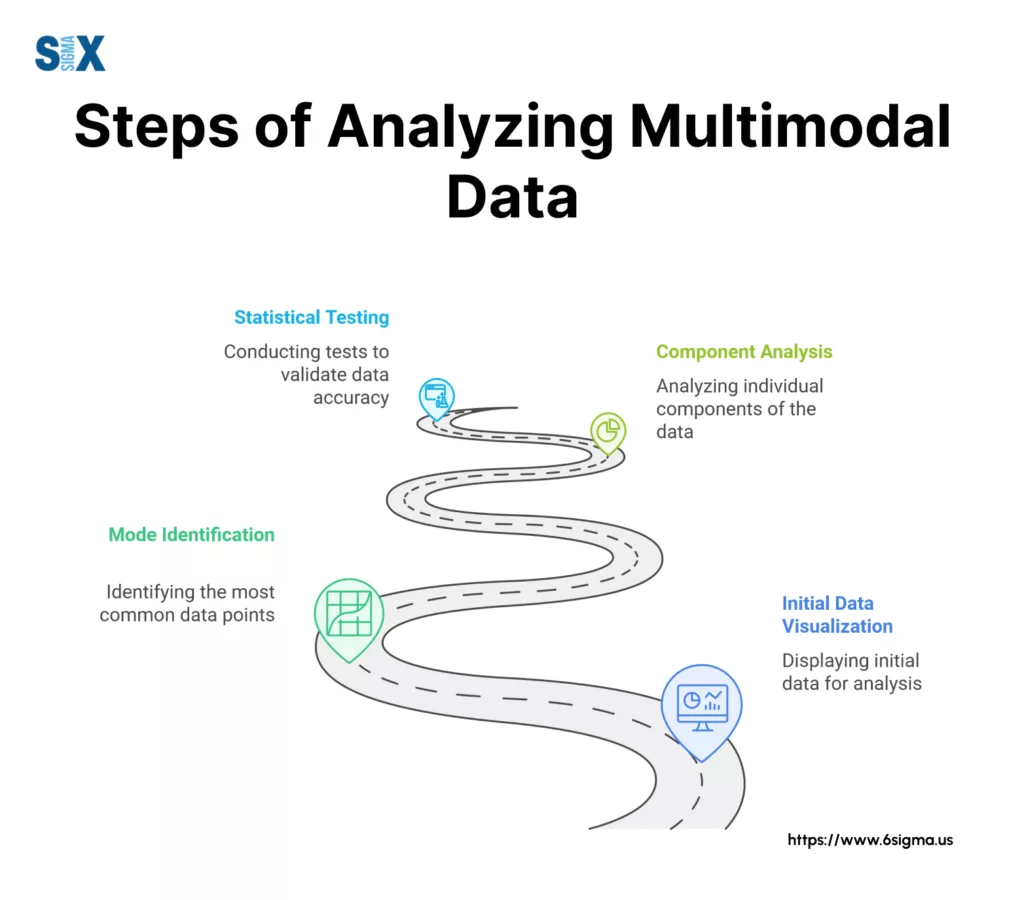
Statistical analysis of multimodal distributions requires specialized approaches that account for multiple peaks and complex data patterns.
Standard statistical measures often fail to capture the true nature of multimodal data.
Descriptive Statistics In Multimodal Distribution Analysis
When analyzing multimodal distributions, traditional measures like mean and median may provide misleading results.
Instead, analysts should identify and report multiple modes, along with their relative frequencies and locations.
The spread of data around each mode helps characterize the distribution’s structure.
Mixture Models And Applications
Mixture models serve as powerful tools for analyzing multimodal distributions by decomposing them into their component distributions.
For example, a bimodal distribution might be modeled as a mixture of two normal distributions, each representing a distinct subpopulation in the data.
Discover how to identify and mitigate process variations through hands-on statistical analysis.
Comparing Distribution Types
Understanding how multimodal distributions differ from other types helps in selecting appropriate analytical methods and interpreting results correctly.
Multimodal Distribution Vs Unimodal Patterns
While unimodal distributions show a single peak, multimodal distributions exhibit multiple peaks that reflect distinct data clusters.
Normal distributions, by definition, are unimodal and symmetric. However, combinations of normal distributions can create multimodal patterns.
Skewness In Multimodal Distribution Data
Multimodal distributions can exhibit skewness, where peaks have different heights or shapes.
This asymmetry often indicates varying proportions of subgroups within the data or underlying processes of different strengths.
Final Thoughts
Multimodal distributions play a crucial role in statistical analysis across various fields.
Their presence signals complex underlying patterns that require careful consideration during data analysis.
Understanding these distributions helps researchers and analysts make more accurate interpretations and better-informed decisions.
The analysis of multimodal distributions continues to evolve with new statistical methods and computational tools.
This growing toolkit enables more sophisticated analysis of complex data patterns across scientific research, business analytics, and other fields.
SixSigma.us offers both Live Virtual classes as well as Online Self-Paced training. Most option includes access to the same great Master Black Belt instructors that teach our World Class in-person sessions. Sign-up today!
Virtual Classroom Training Programs Self-Paced Online Training Programs


