The Definitive Guide to Cycle Time vs Lead Time
Efficiency and optimization are the names of the game. Whether you’re a manufacturer striving to streamline production or a project manager aiming to deliver on time, understanding metrics like cycle time vs lead time can be game-changers.
But what exactly are cycle time and lead time?
Cycle time measures the duration to complete one cycle of a repeatable process – from the moment work begins until it’s finalized.
Lead time, on the other hand, tracks the total time from when a customer request is made to when that request is ultimately fulfilled.
Key Highlights
- Definitions
- Calculation methods
- Analysis techniques
- Applications across industries
- Learn how to leverage these powerful metrics
Understanding Cycle Time and Lead Time
What is Cycle Time?
Cycle time, in the context of process optimization and workflow management, refers to the total time taken to complete one cycle or iteration of a repeatable process. It measures the duration from when active work begins on a task or item until that work is finalized and ready to move to the next step.
The basic formula for calculating cycle time is:
Cycle Time = Total Active Working Time / Number of Items Completed
Tracking cycle time is crucial for identifying bottlenecks and inefficiencies within your production or development workflows. By pinpointing where work gets held up or slowed down, you can take targeted actions to boost throughput and enhance overall efficiency.
Cycle time is a core concept in lean manufacturing principles and the Kanban methodology for agile project management. In Kanban, visualizing cycle times on the Kanban board helps teams optimize their work-in-progress (WIP) limits, ultimately improving flow and delivery speed.
Example: In a software development team using Scrum, the cycle time for a user story could be measured from when a developer starts coding until that story is completed, tested, and ready for deployment.
What is Lead Time?
While cycle time focuses on active working periods, lead time takes a broader view by measuring the total elapsed time from when a customer request or work item is initiated until its final delivery or completion. Lead time essentially encompasses cycle time within its calculation but also accounts for periods when work is queueing, blocked, or waiting in buffers.
The typical formula for lead time is:
Lead Time = Total Time from Initial Request to Final Delivery
Understanding and optimizing lead time is paramount in customer-centric environments like supply chain management or service delivery. It directly impacts an organization’s ability to meet customer expectations and service level agreements (SLAs) in a timely manner.
A key distinction is that while cycle time is viewed from the producer’s perspective, lead time aligns with the customer’s point of view on how long it takes to fulfill their request or receive a product/service.
Example: For a furniture manufacturer, the lead time would span from when a customer places an order to when that order is ultimately shipped and delivered to their doorstep.
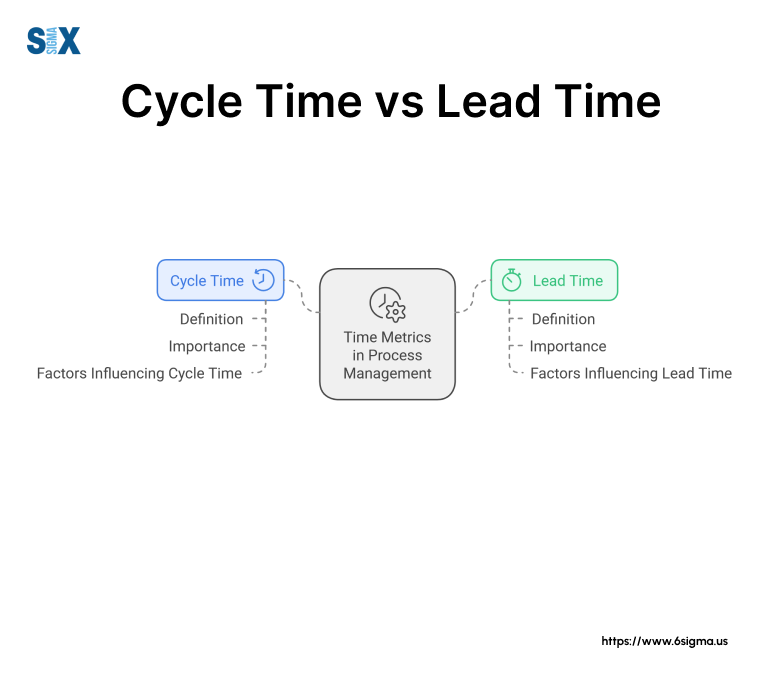
Key Differences Between Cycle Time and Lead Time
To better grasp how cycle time and lead time differ, let’s compare them side-by-side:
| Aspect | Cycle Time | Lead Time |
|---|---|---|
| Definition | Time taken to complete one iteration of a repeatable process | Total elapsed time to deliver a product/service from initial request |
| Scope | Encompasses only active working periods | Includes active work as well as periods of waiting/queueing |
| Perspective | Internal/producer point-of-view | External/customer point-of-view |
| Key Use | Optimize internal workflows, reduce bottlenecks | Set accurate delivery expectations, improve responsiveness |
| Calculation Method | Total Working Time / Items Completed | Total Elapsed Time from Request to Delivery |
While cycle time is a powerful tool for streamlining your processes, lead time takes precedence when it comes to keeping customers happy and maintaining a competitive edge. Optimizing both metrics is essential for achieving true operational excellence.
Example: In a Kanban system for managing software deployments, cycle time would measure just the active periods of coding, testing, and approvals. Lead time, on the other hand, would span the entire duration from when a deployment request is created to when the completed version goes live.
By understanding the key differences between cycle time vs. lead time, you can leverage the right metric at the right time – boosting efficiency with cycle time while elevating customer satisfaction through optimized lead times.
Ready to unlock your organization’s full potential? Our Yellow Belt course equips you with essential tools like cycle time and lead time to drive process optimization and operational excellence.
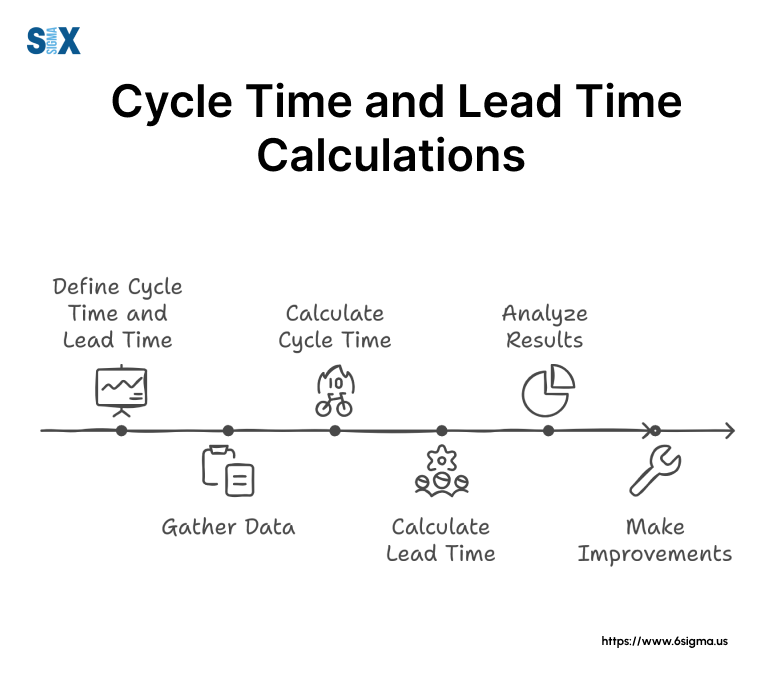
Mastering Cycle Time and Lead Time Calculations
While the basic formulas for cycle time and lead time provide a good starting point, taking a more advanced approach can yield deeper insights and opportunities for optimization.
Let’s explore some next-level calculation methods and best practices.
Advanced Cycle Time Calculations
Tie-in to Throughput, WIP Limits, and Little’s Law
In lean manufacturing and agile methodologies like Kanban, cycle time is closely linked to key concepts like throughput (the number of items completed per unit time) and work-in-progress (WIP) limits.
According to Little’s Law, a fundamental principle in queuing theory, cycle time is directly proportional to WIP and inversely proportional to throughput.
Cycle Time = WIP / Throughput
By carefully managing WIP limits and optimizing flow efficiency, teams can effectively reduce cycle times, leading to faster deliveries and increased productivity.
Complex Calculation Methods
While average cycle time gives you a general sense of your process performance, more advanced statistical methods can provide better predictability and opportunities for improvement:
Percentile Measurements: Instead of just the mean, analyze cycle times at specific percentiles (e.g., 85th, 95th) to understand outliers and set more accurate delivery targets.
Cycle Time Scatterplots: Visualize cycle time data points over time to identify trends, abnormalities, and the impact of process changes.
Cycle Time Histograms: Frequency distributions can reveal multi-modality (multiple peaks), potentially indicating distinct workflow phases or process versions.
Advanced Lead Time Calculations
Factoring in Wait Times and Queue Lengths
While cycle time focuses solely on active working periods, precisely calculating lead time requires accounting for various forms of wait time and queue lengths that can impact the overall duration:
- Order processing and material procurement delays
- Transportation and shipping times
- Blocked/starved resources due to upstream/downstream dependencies
- Buffers and batch delay accumulation at each process stage
Industry-Specific Formulas
Different industries may use specialized lead time calculation formulas based on their unique workflows and constraints:
Manufacturing Lead Time = Procurement Time + Production Run Time + Move Time + Queue Time + Wait Time
Software Lead Time = Requirements Time + Design Time + Code Time + Test Time + Deploy Time
Case Study: Automotive Lead Time Calculation
Consider an automotive manufacturer with the following process:
- Order Processing: 3 days
- Procurement of Raw Materials: 12 days
- Production Run: 6 days (2 shifts per day)
- Transfer to Distribution Center: 2 days
- Held in Queue at DC: 4 days
- Final Delivery to Dealer: 5 days
Total Lead Time = 3 + 12 + (6 * 2) + 2 + 4 + 5 = 32 days
By breaking down lead time into its components, manufacturers can identify delay points and implement targeted solutions like just-in-time logistics or pulling work based on available capacity.
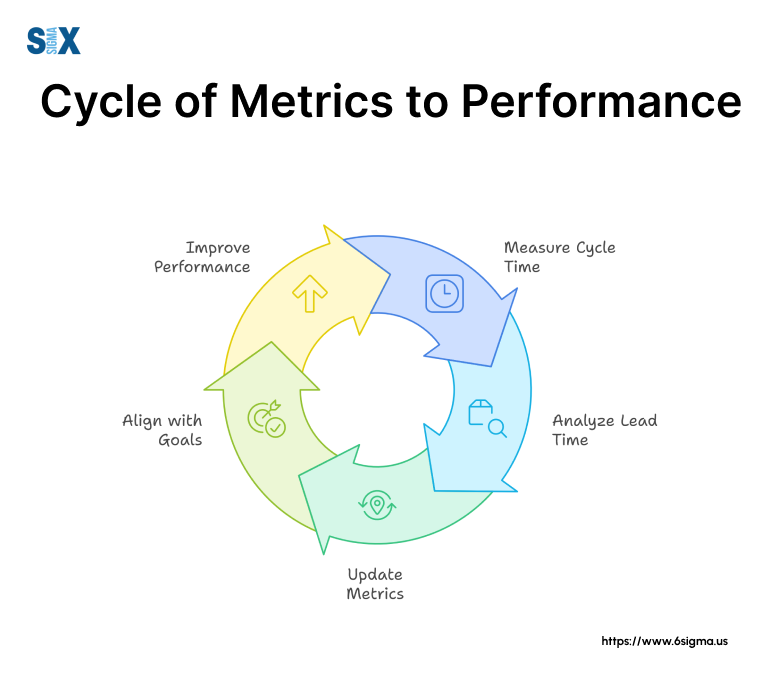
Benchmarking and Continuous Improvement
Using Historical Data to Set Benchmarks
Both cycle time and lead time should be continuously tracked and analyzed to establish meaningful benchmarks tailored to your organization’s processes and industry standards. Benchmark bands (e.g., 85th and 95th percentile lead times) provide more realistic targets compared to simple averages.
Strategies for Optimizing Cycle Time and Lead Time
Some proven methods for reducing cycle times include applying WIP limits, eliminating non-value-added activities, load balancing workstreams, and automating processes where possible. For lead times, just-in-time practices, logistics optimizations, and integrated planning can have a major positive impact.
By taking a systematic approach to calculating, visualizing, and optimizing cycle time and lead time, businesses can unlock new levels of process efficiency, responsiveness, and customer satisfaction.
| Aspect | How to Calculate | What It Measures |
|---|---|---|
| Cycle Time | Total Active Working Time / Number of Items Completed | Time taken to complete one cycle of a repeatable process |
| Lead Time | Total Time from Initial Request to Final Delivery | Total elapsed duration to fulfill a customer request |
Take your process optimization skills to the next level. Learn to apply powerful statistical techniques and master advanced cycle time and lead time calculations in our comprehensive Green Belt program
Applications Across Industries
The insights gleaned from analyzing cycle time vs lead time are invaluable across a multitude of industries and domains.
Here, we explore some key applications that demonstrate the versatility and impact of these lean metrics.
Manufacturing and Supply Chain
In lean manufacturing philosophies like the Toyota Production System, cycle time and lead time are critical parameters for optimizing just-in-time (JIT) inventory management.
By precisely synchronizing material flow with demand signals, manufacturers can dramatically reduce work-in-process (WIP) and inventory carrying costs.
Cycle time metrics, particularly when combined with tools like kanban systems and heijunka (production leveling), allow production lines to achieve highly efficient one-piece flow.
Concurrently, lead time analysis pinpoints bottlenecks and constraints across the extended supply chain, enabling responsive solutions.
Ensuring On-Time Delivery and Reducing Lead Times
Whether producing physical goods or services, customer satisfaction hinges on consistent on-time deliveries. Supply chain managers leverage lead time insights to drive continuous improvement in areas like logistics planning, material replenishment strategies, and supplier management.
The ability to set accurate and reliable lead time estimates is a key competitive advantage, allowing organizations to delight customers with transparency while avoiding costly rushed orders or premium freight charges.
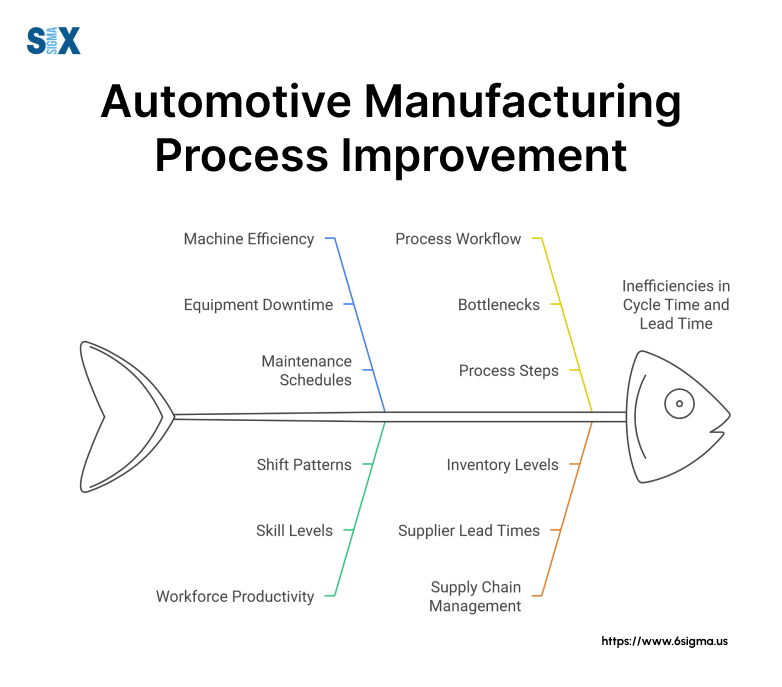
Example: Automotive Supply Chain
Consider an automotive original equipment manufacturer (OEM) that produces 1,000 vehicles per month.
By rigorously monitoring cycle times at each stage of production, from raw material handling to subassembly and final assembly, the company can identify opportunities for cycle time reduction.
Implementing cellular manufacturing with single-piece flow decreased average cycle times from 5 days to just 3 hours, substantially improving throughput.
In parallel, critical path analysis revealed inbound logistics as the primary constraint on overall lead times.
Applying lean principles in the logistics process through milk runs and kanban resupply reduced lead times from 21 days to just 8 days.
Software Development and Project Management
In agile software development methodologies like Scrum, the concept of cycle time vs lead time in kanban directly manifests through workflows visualized on physical or digital kanban boards. By carefully measuring and optimizing cycle times for activities like grooming stories, development, testing, and deployment, teams can incrementally and predictably deliver high-quality software.
Scrum processes like sprint planning, daily standups, and retrospectives provide the critical inspect-and-adapt feedback loops to systematically reduce cycle times.
On the other hand, tracking lead times from concept to cash allows product organizations to accurately forecast roadmaps and set stakeholder expectations.
Forecasting Project Timelines Accurately
Whether delivering a software product or executing any other large-scale project, cycle time and lead time metrics are instrumental in estimating realistic timelines and delivery dates.
Project managers leverage advanced forecasting techniques like Monte Carlo simulations, feeding real-world cycle time distributions as inputs.
This level of quantitative rigor around estimation prevents the overoptimistic thinking that frequently plagues project schedules.
Healthcare and Service Delivery
In healthcare environments like hospitals and clinics, enhancing patient experience by minimizing wait times and delays is paramount.
By viewing patient journeys as a workflow, lean thinking techniques like value stream mapping and cycle time analysis can unlock transformative improvements.
For example, emergency departments have applied these methodologies to streamline patient flow, from triage and diagnosis through treatment and discharge.
By optimizing cycle times for steps like registration, physician evaluation, and procedure completion, overall lead times (total length of stay) decrease dramatically.
Scheduling and Resource Allocation
Service delivery organizations across sectors like consulting, legal, and creative fields face the perpetual challenge of optimally allocating limited resources (employees, equipment, facilities) to meet fluctuating demands.
Here too, lead time and cycle time metrics provide critical insights.
For instance, quantifying cycle times for activities like client acquisition, project resourcing, and service delivery directly informs staff forecasting models. Similarly, analyzing lead times from initial inquiry to project kickoff allows professional service firms to set accurate fee quotes while maintaining a competitive edge.
Example: Emergency Room Process Improvement
A regional healthcare provider aimed to enhance patient experience by reducing lead times in their emergency department (ED).
By mapping the current state value stream, analysts found that the median lead time from arrival to discharge was 238 minutes, with a wide range of 32 minutes to 16 hours.
Excessive wait times and high cycle times were most pronounced during peak hours of 11 AM – 11 PM. A dedicated “ExpressCare” workflow with co-located triage, registration, and treatment rooms was implemented for low-acuity patients during this period.
Within 6 months, this focused application of cycle time strategies decreased median lead times for ExpressCare by 68% while simultaneously reducing ED load on main workflows.
More importantly, patient satisfaction scores increased from the 25th percentile to the 90th percentile nationally.
Whether optimizing manufacturing operations, accelerating software delivery, or enhancing service excellence, mastering the nuances of cycle time vs lead time equips organizations to achieve operational agility and competitive supremacy.
Ready to become a process optimization expert? Our Black Belt course prepares you to lead organization-wide initiatives and drive strategic excellence through advanced lean techniques like cycle time and lead time analysis.
Advanced Analysis and Emerging Trends
As organizations strive for higher levels of operational excellence, the ways in which cycle time and lead time are measured, analyzed, and optimized are evolving rapidly.
In this section, we explore cutting-edge practices that are shaping the future of process and workflow improvement.

Data-Driven Process Optimization
Leveraging BI Tools and Dashboards
Rather than dealing with fragmented data sources, progressive organizations are consolidating their cycle time and lead time metrics into sophisticated business intelligence (BI) platforms and visual dashboards.
This centralized, real-time view allows stakeholders across functions to monitor performance, identify bottlenecks, and drive data-backed decisions.
For instance, a BI dashboard could juxtapose control charts showing the cycle time trends for critical processes alongside projections of their impact on overall lead times.
This level of visibility empowers proactive interventions before issues escalate.
Predictive Analytics for Cycle/Lead Time Forecasting
Why merely monitor historical metrics when you could harness data science to accurately forecast future cycle times and lead times?
By combining techniques like machine learning and discrete event simulation, organizations can build powerful predictive models that account for variability, constraints, and improvement initiatives.
Rather than relying on simplistic averages or overtly conservative estimates, these models generate statistically robust predictions at specified confidence levels.
For instance, a forecast could indicate an 85% probability that the lead time for a complex product will fall between 14-18 weeks based on current process parameters.
Example: Machine Learning for Cycle Time Prediction
A major semiconductor manufacturer aimed to improve their production scheduling accuracy by leveraging data science.
They fed over 5 years of historical cycle time data from multiple fabrication facilities into an AI/ML model.
This data was enriched with contextual attributes like product mix, equipment maintenance schedules, HR records, and more.
The resulting machine learning model could accurately predict cycle times 3-4 months in advance with >85% accuracy based on the incoming order book and operational parameters.
This empowered considerably tighter production scheduling and de-risked customer commitments, reducing air freight costs by over $25 million annually while improving on-time delivery rates.
Role in Organizational Agility and Resiliency
Tying Metrics to Broader Business Goals
While the core purpose of cycle time and lead time centers on process improvement, forward-thinking leaders recognize how optimizing these metrics contributes to larger organizational goals around agility, resilience, and competitiveness.
By tightly coupling cycle and lead time KPIs with broader strategic objectives like time-to-market, revenue growth, and customer satisfaction, companies can craft cohesive transformation roadmaps.
This systems-level thinking recognizes that localized process efficiencies ultimately elevate overall business performance.
Building Agile, Responsive Supply Chains
Rapid demand shifts, and supply disruptions, supply chain agility has become non-negotiable.
Advanced organizations are leveraging prescriptive analytics around cycle times and lead times to build resilient, demand-driven supply chains that can swiftly adapt to changing conditions.
For instance, AI/ML models can continuously evaluate the impact of supply chain risks on projected lead times, triggering contingency plans that rebalance production, reroute logistics, or scale capacity using dynamic lead time offsets.
Example: Supply Chain Risk Mitigation with Lead Time Analysis
When the COVID-19 pandemic disrupted global logistics networks, a leading CPG manufacturer rapidly remodeled their supply chain using lead time analysis.
Their analytical models ingested real-time lead time data from suppliers and logistics providers worldwide.
This data fueled optimization algorithms that dynamically rerouted shipments and rebalanced production across manufacturing sites to maintain service levels.
By proactively managing lead times during the disruption, they avoided $72 million in costs from expedited shipping and excess safety stock while maintaining 96% on-time delivery performance.
Impact of Automation and Industry 4.0
How Technologies Affect Cycle and Lead Time Metrics
The Fourth Industrial Revolution is fundamentally reshaping manufacturing and supply chain processes through technologies like industrial IoT, collaborative robotics, AI/ML, additive manufacturing, and more.
While these digital capabilities drive tremendous productivity gains, they also have a profound influence on how cycle times and lead times should be measured and managed.
For instance, smart factories could feature disparate cycle times for manually operated processes versus fully automated lines. Connected supply networks may require bifurcated lead time tracking — one for physical shipments, another for digital transfers of designs and instructions.
Monitoring Metrics in Automated Environments
Emerging technologies necessitate a re-evaluation of cycle and lead time monitoring practices.
In highly automated facilities, the precision and granularity of data captured by IoT sensors and machine vision systems allow nuanced analyses that were infeasible in legacy setups.
For example, while a conventional cycle time measurement may only track the duration from when an operator loaded parts into a CNC machine to when they were unloaded, Industry 4.0 solutions can capture cycle times for each individual operation performed by the machine, down to the axis motion level.
Example: Automated Cycle Time Tracking with IoT
A medical device manufacturer deployed an IoT sensor network to thoroughly instrument their injection molding machines and auxiliary systems like chillers, conveyors, and robotic loaders/unloaders.
This unified sensor data was streamed into a manufacturing execution system (MES) that automatically computed cycle times across the entire production line with sub-second precision.
AI analytics identified anomalous cycle time patterns, often revealing issues like mold degradation, imbalanced loading, or robot faults that would have gone unnoticed in traditional setups.
Within 6 months of deploying this automated cycle time tracking approach, the company increased OEE from 68% to 83%, avoiding millions in quality costs and lost productivity.
While core principles around cycle time vs lead time endure, the paradigms for analyzing and optimizing these metrics continue to evolve rapidly alongside technological progress.
Businesses that embrace advanced analytics and emerging industry 4.0 technologies will be poised to outpace competitors through sustained operational agility.
Conclusion
The difference between organizational success and stagnation often lies in the ability to optimize processes, enhance efficiencies, and consistently deliver value to customers.
Cycle time and lead time are powerful metrics that lie at the heart of this pursuit of operational excellence.
Throughout this comprehensive guide, we’ve explored the core definitions, calculations, and applications of cycle time vs. lead time across industries like manufacturing, software development, supply chain, and service delivery.
From leveraging advanced analytical techniques like machine learning and prescriptive modeling to capitalizing on emerging technologies that enable nuanced cycle/lead time tracking, the opportunities for process optimization are boundless.
As the business world continues to evolve, mastering the nuances of cycle time vs. lead time will be instrumental in building resilient, agile, and future-ready organizations that can outmaneuver the competition.
The time to elevate your operational capabilities is now.
Whether you’re just beginning your lean journey or seeking to push performance to new heights, prioritize cycle time and lead time as foundational metrics for continuous improvement.
Explore best-in-class tools, upskill your teams, and foster a culture of relentless optimization to unlock sustainable competitive advantages.
SixSigma.us offers both Live Virtual classes as well as Online Self-Paced training. Most option includes access to the same great Master Black Belt instructors that teach our World Class in-person sessions. Sign-up today!
Virtual Classroom Training Programs Self-Paced Online Training Programs


