Unimodal Distribution: A Comprehensive Guide with Interactive Tools
In data analysis, understanding statistical distributions is crucial, a unimodal distribution is a probability distribution with a single peak or mode.
But there’s so much more to discover.
Key Highlights
- Understanding the concept Unimodal Distribution
- Characteristics
- Types of Unimodal Distribution
Understanding Unimodal Distribution
What is a unimodal distribution? At its core, a unimodal distribution is a probability distribution with a single peak or mode.
This unique characteristic sets it apart from other distribution types and makes it a fundamental concept in statistics and data analysis.
Key characteristics of unimodal distributions include:
- Single Peak: The most defining feature is the presence of one distinct high point or mode.
- Symmetry or Skewness: Unimodal distributions can be symmetric (like the normal distribution) or skewed.
- Continuous or Discrete: They can represent both continuous and discrete data.
- Varying Shapes: While always having one peak, the overall shape can range from bell-curved to more asymmetrical forms.
Understanding unimodal distributions is crucial in statistics as they represent many real-world phenomena, from height distributions in populations to manufacturing process variations, a key focus area for professionals pursuing Six Sigma certification.
Visual Representation
A unimodal distribution histogram provides a clear visual representation of the data’s shape and distribution.
These histograms typically show frequency on the vertical axis and the variable of interest on the horizontal axis.
Interpreting a unimodal distribution graph involves:
- Identifying the peak (mode)
- Assessing symmetry or skewness
- Observing the spread of data around the peak
For example, a unimodal distribution example might show customer satisfaction scores for a product, with most responses clustering around a single rating—a common scenario analyzed in Six Sigma certification programs to improve quality control.
Comparing Unimodal Distribution with Other Distribution Types
While unimodal distributions have one peak, other types include:
- Bimodal Distributions: Two distinct peaks
- Multimodal Distributions: Multiple peaks
Key differences:
- Number of peaks
- Data interpretation complexity
- Underlying data characteristics
When to use unimodal distribution vs. others:
- Use unimodal when data naturally clusters around a single value
- Choose bimodal or multimodal when data shows multiple distinct groups or influences
Understanding these differences is crucial for accurate data interpretation and statistical analysis across various fields, from market research to scientific studies making it a foundational skill for those seeking Six Sigma certification.
By grasping the concept of unimodal distributions, you’re equipped to better understand and analyze a wide range of data sets in your professional or academic pursuits.
Elevate your data analysis skills with our Yellow Belt course equips you with essential tools to interpret various distributions confidently.
Types of Unimodal Distributions
There are majorly two types of Unimodal Distribution.
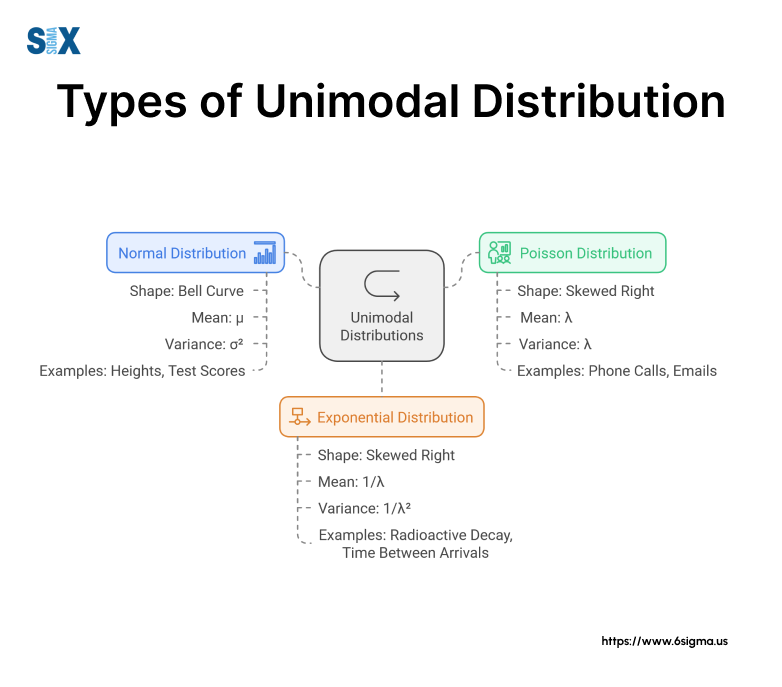
Normal Distribution
The normal distribution, also known as the Gaussian distribution, is perhaps the most well-known example of a unimodal distribution.
It’s characterized by its symmetrical, bell-shaped curve, making it a perfect unimodal distribution example.
Key properties of the normal distribution include:
- Symmetry around the mean
- Mean, median, and mode are all equal
- 68% of data falls within one standard deviation of the mean
Real-world examples of normal distribution include:
- Heights of adults in a population
- IQ scores
- Measurement errors in scientific experiments
Poisson Distribution
The Poisson distribution is another important unimodal distribution example, often used to model the number of events occurring within a fixed interval of time or space.
When and why to use Poisson distribution:
- Modeling rare events
- When the average rate of occurrence is known
- For independent events
Practical applications of Poisson distribution include:
- Number of customers arriving at a store in an hour
- Number of defects in a manufactured product
- Number of phone calls received by a call center in a day
Other Unimodal Distributions
While normal and Poisson distributions are common, several other unimodal distributions exist:
Exponential Distribution
- Used to model time between events in a Poisson process
- Example: Time between customer arrivals at a bank
Log-normal Distribution
- Used when the logarithm of a variable follows a normal distribution
- Example: Distribution of incomes in a population
Chi-square Distribution
- Often used in hypothesis testing
- Example: Analyzing variances in quality control
Comparison of Unimodal Distributions:
| Distribution | Shape | Symmetry | Common Applications |
|---|---|---|---|
| Normal | Bell-shaped | Symmetric | Heights, IQ scores |
| Poisson | Right-skewed | Asymmetric | Rare event counts |
| Exponential | Right-skewed | Asymmetric | Time between events |
| Log-normal | Right-skewed | Asymmetric | Income distributions |
Understanding these various unimodal distribution examples is crucial for choosing the right model for your data analysis.
Each type of unimodal distribution has its unique properties and applications, making them valuable tools in statistics and data science.
By familiarizing yourself with these different types of unimodal distributions, you’ll be better equipped to analyze and interpret a wide range of data sets in your professional or academic work.
Take your data analysis skills to the next level. Learn to apply powerful statistical tools and make data-driven decisions in our comprehensive Green Belt program.
Mathematical Properties and Formulas
Understanding the mathematical properties of unimodal distributions is crucial for data analysis.
Let’s explore the key concepts of mode, mean, and median in the context of unimodal distributions.
- Mode: In a unimodal distribution, the mode is the value that occurs most frequently. It represents the peak of the distribution.
- Mean: The arithmetic average of all values in the distribution.
- Median: The middle value when the data is arranged in order.
In a perfectly symmetric unimodal distribution, like the normal distribution, the mode, mean, and median are equal.
However, in skewed unimodal distributions, their relationships change:
- Right-skewed: Mode < Median < Mean
- Left-skewed: Mean < Median < Mode
For example, in a right-skewed unimodal distribution of salaries, the mode (most common salary) would be less than the median, which would be less than the mean (average salary).
In quality control, you might use these formulas to analyze the distribution of product weights, a critical step in root cause analysis for process improvement.
Important Formulas of Unimodal Distribution
Let’s examine some essential formulas related to unimodal distributions:
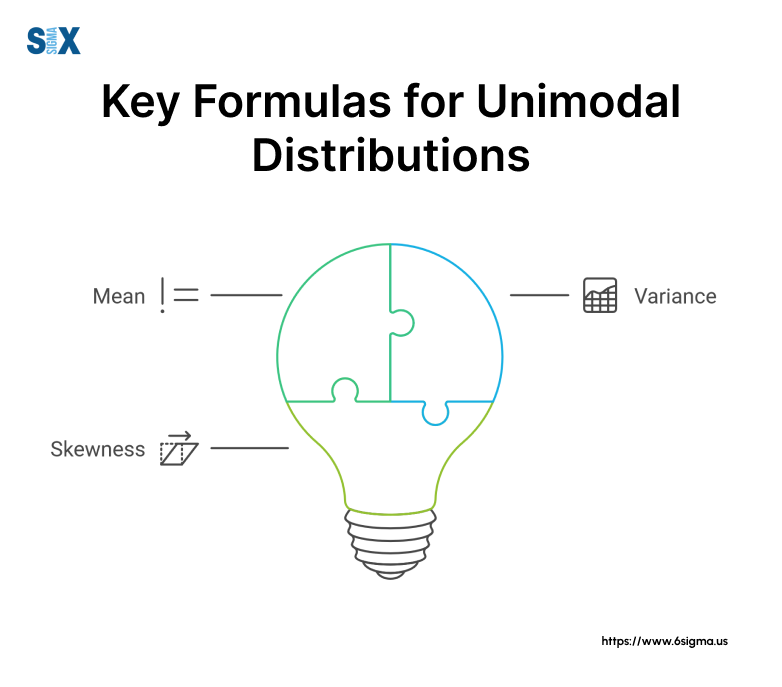
- Mean (μ) for a discrete distribution:
μ = Σ(x * P(x))
Where x is each value and P(x) is its probability. - Variance (σ²):
σ² = Σ((x – μ)² * P(x)) - Standard Deviation (σ):
σ = √σ² - Skewness:
Skewness = (Mean – Mode) / Standard Deviation
These formulas are crucial for analyzing unimodal distribution examples in various fields. For instance, in quality control, you might use these to analyze the distribution of product weights.
Step-by-step guide for calculating key measures in unimodal distributions:
- Collect and organize your data
- Identify the mode (peak of the distribution)
- Calculate the mean using the formula above
- Determine the median by arranging data in order and finding the middle value
- Calculate variance and standard deviation
- Assess skewness by comparing mode, mean, and median positions
By mastering these mathematical properties and formulas, you’ll be well-equipped to analyze and interpret unimodal distributions in your statistical endeavors, whether you’re a student, researcher, or data professional.
Ready to become a statistical analysis expert? Our Black Belt course prepares you to handle complex distributions and drive strategic excellence.
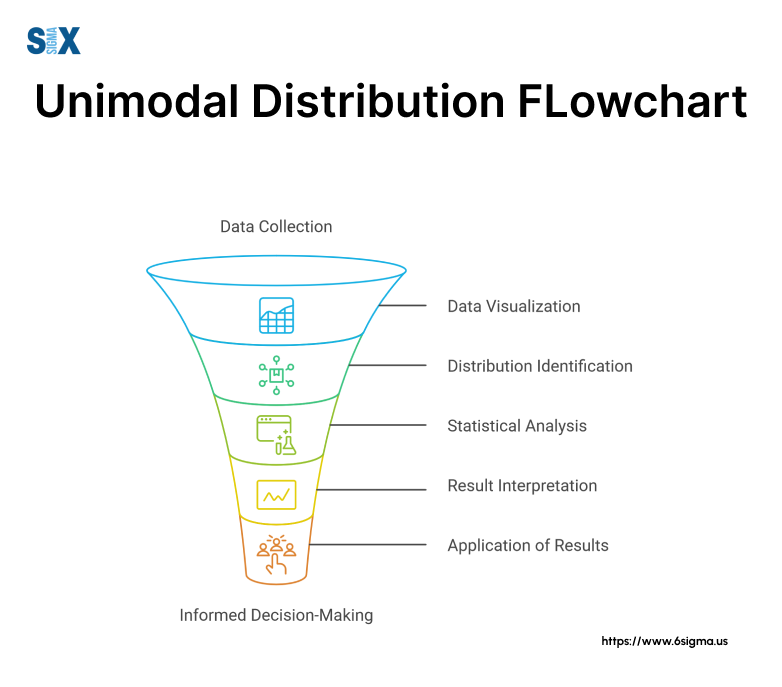
Identifying and Analyzing Unimodal Distributions
Determining whether a distribution is unimodal is crucial for proper data analysis. Here’s a step-by-step process to identify a unimodal distribution:
- Visualize the data: Create a histogram or density plot.
- Observe the shape: Look for a single, distinct peak.
- Check for symmetry: Assess if the distribution is symmetric or skewed.
- Examine the tails: Observe how quickly they taper off on both sides.
- Consider the sample size: Ensure it’s large enough for reliable analysis.
Common pitfalls in identifying unimodal distributions include:
- Mistaking noise for multiple modes in small samples
- Overlooking slight asymmetry in nearly symmetric distributions
- Assuming all bell-shaped curves are normal distributions
Tools and Techniques for Analysis
Several statistical software packages and tools are available for analyzing unimodal distributions:
- R: Powerful, free software with extensive statistical capabilities
- Python (with libraries like NumPy and SciPy): Versatile for data analysis and visualization
- SPSS: User-friendly software popular in social sciences
- Minitab: Often used in Six Sigma and quality improvement projects
Best practices for data visualization of unimodal distributions include:
- Using appropriate bin sizes in histograms
- Overlaying theoretical distribution curves on empirical data
- Employing Q-Q plots to assess normality
Interpreting Results with the Unimodal Distribution
To draw meaningful conclusions from unimodal distribution analysis:
- Identify the central tendency: Understand what the peak represents in your context.
- Assess variability: Examine the spread of the data around the peak.
- Consider skewness: Determine if there’s a longer tail on one side and its implications.
- Compare to theoretical distributions: See how well your data fits known unimodal distributions.
Common misconceptions to avoid:
- Assuming all unimodal distributions are normal distributions
- Overlooking the importance of sample size in shaping the distribution
- Ignoring potential outliers that may affect the distribution’s shape
Common Misconceptions about the Unimodal Distribution
Let’s address some common misunderstandings about unimodal distributions:
- Myth: All unimodal distributions are normal distributions.
Reality: While normal distributions are unimodal, not all unimodal distributions are normal. For example, the exponential distribution is unimodal but not normal. - Myth: Unimodal distributions are always symmetric.
Reality: Unimodal distributions can be symmetric or skewed. The normal distribution is symmetric, but many unimodal distributions, like the exponential distribution, are skewed. - Myth: The peak of a unimodal distribution always represents the mean.
Reality: In symmetric unimodal distributions, the peak represents the mean, median, and mode. However, in skewed distributions, these measures can differ.
Frequently Asked Questions
Here are some common questions about unimodal distributions:
A unimodal distribution is a probability distribution with a single peak or mode in its probability density function or histogram.
Yes, the normal distribution is a classic example of a unimodal distribution.
Unimodal distributions can have various shapes, including symmetric bell curves, skewed curves, and even uniform distributions with a flat top.
To check if a distribution is unimodal:
– Create a histogram or density plot of the data
– Look for a single, distinct peak
– Ensure there are no other significant peaks or modes
Not necessarily. While normal distributions are unimodal, not all unimodal distributions are normal. Other types of unimodal distributions include exponential, Poisson, and log-normal distributions.
Mastering these distributions is a key competency in Six Sigma Green Belt certification, where professionals learn to apply statistical tools to optimize processes.
Understanding these common misconceptions and questions can help you better interpret and apply unimodal distributions in your data analysis work, whether you’re a student, researcher, or professional working with statistical data.
By clarifying these points, you’ll be better equipped to identify, analyze, and interpret unimodal distributions accurately in various contexts.
Conclusion
As we wrap up our exploration of unimodal distributions, let’s recap the key points we’ve covered:
- We began by answering the fundamental question: “What is a unimodal distribution?” We learned that it’s a probability distribution characterized by a single peak or mode.
- We examined various unimodal distribution examples, from the symmetrical normal distribution to the skewed exponential and Poisson distributions.
- We explored how to identify unimodal distributions using tools like unimodal distribution histograms and density plots.
- We delved into the mathematical properties and formulas that define these distributions, enhancing our analytical capabilities.
- Finally, we addressed common misconceptions and answered questions about unimodal distributions.
Understanding unimodal distributions is crucial in numerous fields, from quality control in manufacturing to data analysis in scientific research.
As data continues to drive decision-making across industries, the ability to recognize, analyze, and interpret unimodal distributions becomes increasingly valuable.
We encourage you to apply this knowledge in your work, whether you’re a student tackling statistical problems, a researcher analyzing experimental data, or a professional optimizing business processes. Remember, practice is key to mastering these concepts.
For those eager to dive deeper, explore the resources linked throughout this article. They offer additional insights into the fascinating world of probability distributions and statistical analysis.
Keep exploring, keep analyzing, and keep pushing the boundaries of what’s possible with data!
SixSigma.us offers both Live Virtual classes as well as Online Self-Paced training. Most option includes access to the same great Master Black Belt instructors that teach our World Class in-person sessions. Sign-up today!
Virtual Classroom Training Programs Self-Paced Online Training Programs


