Mastering Left vs Right Skewed Histogram: Unlocking Data’s Hidden Stories
In data analysis, not all distributions are created equal.
In skewed histograms, where data tells a tale of asymmetry and hidden insights.
Understanding the nuances between left skewed vs right skewed histogram/distributions is crucial for anyone navigating the complex landscape of statistics and data science, especially for professionals aiming for process improvement mastery. Foundational statistical knowledge, like understanding data distribution, is a key component covered in six sigma certification programs.
Key Highlights
- Concepts of left and right skewed histograms
- distinguish between skewed right vs skewed left histograms
- Understand their implications in various fields
- Practical applications in business, project management, and beyond.
Understanding Skewness: The Basics
A histogram is a powerful visual tool in data analysis, representing the distribution of numerical data. It consists of adjacent rectangles, each representing a range of values (bins) and their frequency.
The height of each rectangle corresponds to the number of data points falling within that bin.
Key components of a histogram include:
- Bins: Intervals that divide the range of data
- Frequencies: The number of data points in each bin
- Y-axis: Typically represents the frequency or count
- X-axis: Represents the range of values in the dataset
Histograms are crucial in data visualization as they provide insights into the shape, center, and spread of data distributions. These foundational skills are emphasized in six sigma certification programs, which train professionals to interpret data patterns for quality improvement initiatives.
They help identify patterns, outliers, and potential skewness in datasets.
Defining Skewness
Skewness refers to the asymmetry in a data distribution. In a perfectly symmetrical distribution, the left and right sides mirror each other.
However, real-world data often exhibits skewness, leaning towards one side or the other.
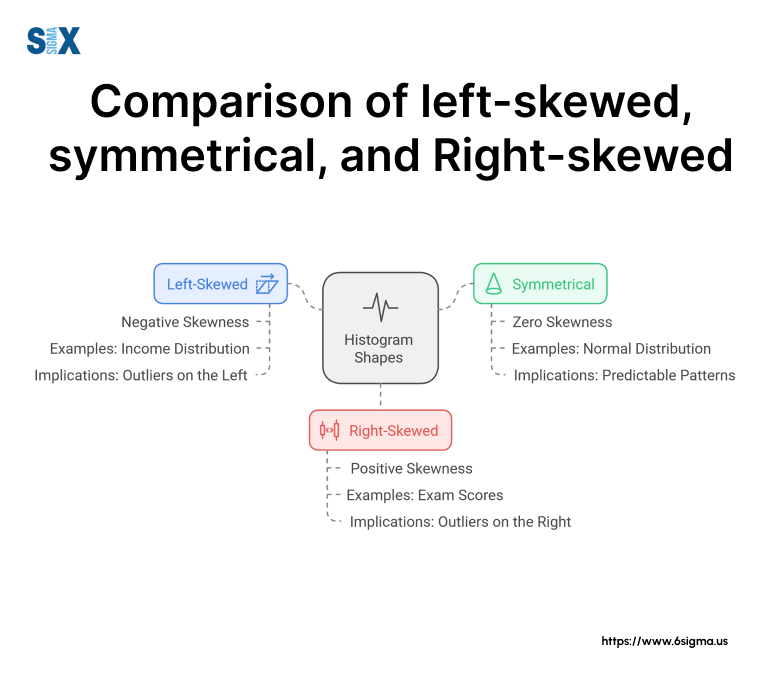
When comparing a right vs left skewed histogram, we observe:
- Left-skewed (negatively skewed): The tail extends to the left, with most data concentrated on the right
- Right-skewed (positively skewed): The tail extends to the right, with most data concentrated on the left
Understanding whether a distribution is skewed left or right is crucial for accurate data interpretation and analysis. Individuals pursuing six sigma certification are taught how to detect skewness when analyzing business processes. They can apply their knowledge to understand the skewness and correct the data to generate more accurate insights.
Measures of Central Tendency in Skewed Distributions
In skewed distributions, the relationships between mean, median, and mode differ from those in symmetrical distributions:
- Left-skewed distributions:
• Mode > Median > Mean - Right-skewed distributions:
• Mean > Median > Mode - Symmetrical distributions:
• Mean = Median = Mode
The impact of skewness on these measures is significant. In a right-skewed distribution, the mean is pulled towards the tail, while in a left-skewed distribution, it’s pulled towards the lower values.
This effect on central tendency measures can greatly influence data interpretation and decision-making.
Understanding the relationships between these measures helps in identifying whether data is skewed left or right.
For instance, if the mean is greater than the median, it’s likely a right-skewed distribution.
To reinforce these concepts, imagine an interactive slider showing how changing data points affects skewness.
As you move data points, you’d see the histogram shape change, along with the positions of the mean, median, and mode, illustrating the dynamic nature of skewness in data distributions.
By mastering these basics of skewness, you’re better equipped to analyze and interpret various data distributions, whether they’re skewed right vs left or symmetrical.
This knowledge forms the foundation for more advanced statistical analyses and data-driven decision-making across various fields.
Ready to enhance your data analysis skills? Our Yellow Belt course provides essential tools to interpret skewed distributions with confidence.
Left Skewed Histograms: Characteristics and Interpretation
When exploring the concept of left vs right skewed histogram, it’s crucial to understand the characteristics of left skewness.
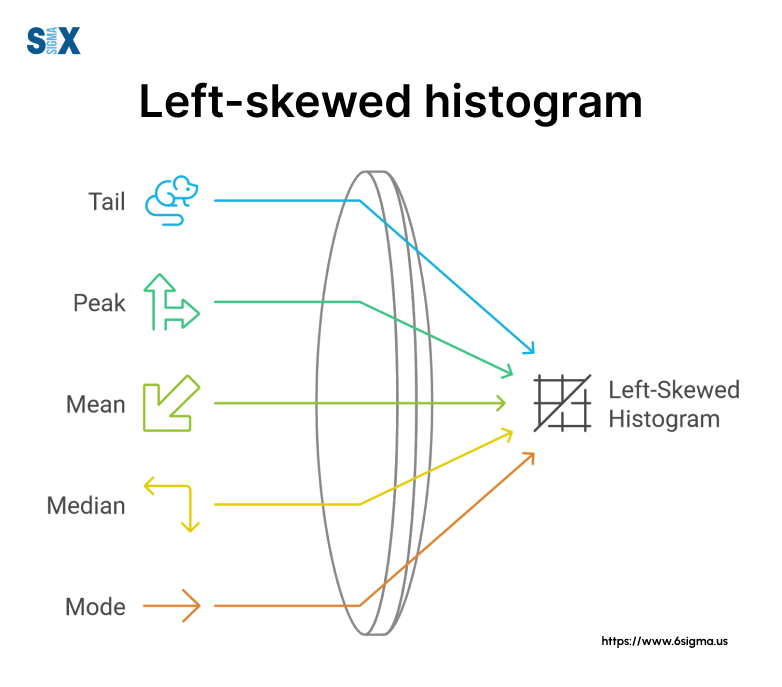
A left-skewed histogram, also known as negatively skewed, displays a distinct visual pattern:
- The tail of the distribution extends towards the left side
- The majority of data points cluster on the right side
- The peak (mode) is situated on the right side of the center
In left-skewed distributions, extreme low values pull the tail to the left, creating an asymmetrical shape. This tail direction is key in distinguishing between skewed left or right distributions.
Mean, Median, and Mode in Left Skewed Distributions
In left-skewed distributions, the relationship between measures of central tendency follows a specific pattern:
Mode > Median > Mean
This relationship is crucial for interpreting data in left-skewed distributions:
- The mode (most frequent value) is the highest
- The median (middle value) falls between the mode and mean
- The mean is pulled towards the left tail by extreme low values
Understanding these relationships helps in accurately interpreting data and making informed decisions based on the appropriate measure of central tendency.
Real-world Examples of Left Skewed Distributions
Left-skewed distributions are common in various real-world scenarios:
- Age at death in populations:
• Most deaths occur at older ages
• Fewer deaths at younger ages create the left tail - Reaction times in psychological studies:
• Most reactions cluster around a faster time
• Some extremely slow reactions extend the left tail
These examples illustrate how left-skewed distributions can provide valuable insights in different fields, from demographics to cognitive psychology.
Right Skewed Histograms: Characteristics and Interpretation
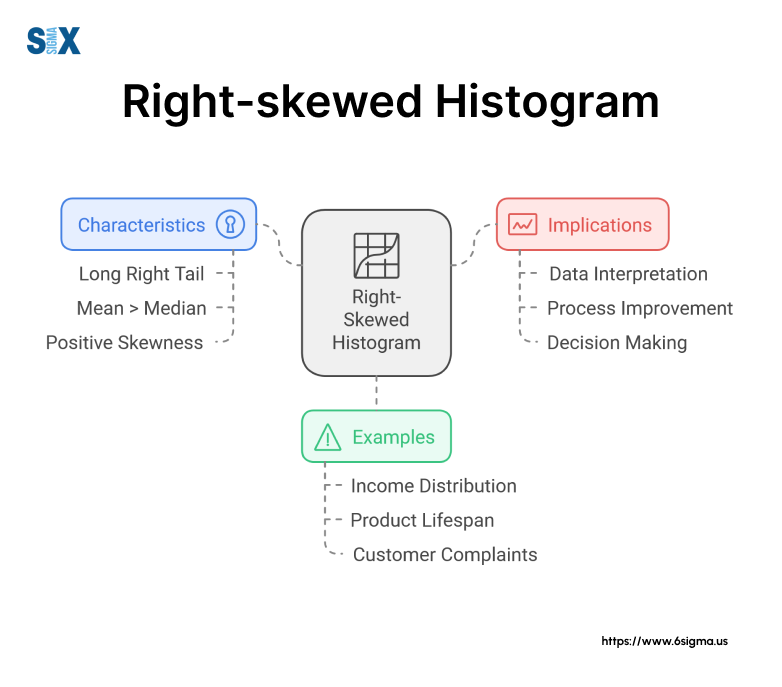
Contrasting with left skewness, right-skewed histograms, also known as positively skewed, exhibit distinct characteristics:
- The tail of the distribution extends towards the right side
- The majority of data points cluster on the left side
- The peak (mode) is situated on the left side of the center
In right-skewed distributions, extreme high values pull the tail to the right, creating an asymmetrical shape opposite to left-skewed distributions.
Mean, Median, and Mode in Right Skewed Distributions
Right-skewed distributions display a unique relationship between measures of central tendency:
Mean > Median > Mode
This pattern is essential for interpreting right-skewed data:
- The mean is pulled towards the right tail by extreme high values
- The median falls between the mean and mode
- The mode (most frequent value) is the lowest
Recognizing these relationships is crucial for choosing the most appropriate measure of central tendency in right-skewed datasets.
Real-world Examples of Right Skewed Distributions
Right-skewed distributions are prevalent in many areas:
- Income distributions:
• Most incomes cluster at lower levels
• A few extremely high incomes create the right tail - Test scores in difficult exams:
• Many students score lower
• A few high achievers extend the right tail
These examples demonstrate how right-skewed distributions can reveal important patterns in economic and educational contexts.
Understanding the differences between a right vs left skewed histogram is crucial for accurate data interpretation.
By recognizing the characteristics and real-world applications of both left and right skewed distributions, analysts can make more informed decisions and draw more accurate conclusions from their data.
Take your data analysis skills to the next level. Learn to apply powerful statistical tools and make data-driven decisions in our comprehensive Lean Six Sigma Green Belt program.
Implications of Skewness in Data Analysis
Understanding the implications of left vs right skewed histograms is crucial for accurate data analysis across various fields.
A Six Sigma Green Belt certification equips analysts with advanced tools to for example model skewed financial data and mitigate risks effectively.
Impact on Statistical Tests
Many statistical tests assume that data follows a normal distribution.
Pairing statistical adjustments with root cause analysis training (a core Six Sigma component) ensures comprehensive problem-solving.
However, when dealing with skewed data, whether skewed left or right, this assumption is violated, potentially leading to inaccurate conclusions.
Assumption of normality
- Tests like t-tests and ANOVA assume normal distribution. Skewed data can lead to incorrect p-values and confidence intervals.
Adjusting analyses for skewed data:
- Use non-parametric tests (e.g., Mann-Whitney U test instead of t-test)
- Apply data transformations (e.g., log transformation for right-skewed data)
- Utilize robust statistical methods that are less sensitive to skewness
Skewness in Financial Analysis
In finance, understanding a right vs left skewed histogram is crucial for accurate risk assessment and investment decisions.
- Stock returns and risk assessment:
- Right-skewed returns: Indicate potential for large gains but more frequent small losses
- Left-skewed returns: Suggest more frequent small gains but potential for large losses
- Interpreting skewed financial data:
- Use median instead of mean for central tendency in skewed distributions
- Consider skewness when calculating Value at Risk (VaR)
- Adjust portfolio strategies based on the direction of skewness
Skewness in Social Sciences
Social science research often encounters skewed data, particularly in survey responses and demographic studies.
- Interpreting skewed survey responses:
- Left-skewed responses might indicate social desirability bias
- Right-skewed responses could suggest extreme opinions or experiences
- Adjusting for skewness in research findings:
- Use appropriate statistical methods for skewed data
- Consider the context and potential reasons for skewness
- Report median and interquartile range instead of mean and standard deviation
To better understand the implications of skewed left or right data across different fields, let’s compare them side-by-side:
| Aspect | Left-Skewed Data | Right-Skewed Data |
|---|---|---|
| Statistical Tests | Use non-parametric tests or transform data | Use non-parametric tests or transform data |
| Financial Returns | More frequent small gains, potential for large losses | More frequent small losses, potential for large gains |
| Survey Responses | May indicate social desirability bias | May suggest extreme opinions or experiences |
| Risk Assessment | Focus on potential large losses | Focus on potential large gains |
| Central Tendency | Median > Mean | Mean > Median |
| Data Transformation | Consider exponential transformation | Consider logarithmic transformation |
Understanding these implications is crucial when analyzing skewed data.
Ready to become a statistical analysis expert? Our Lean Six Sigma Black Belt course prepares you to handle complex skewed distributions and drive strategic excellence.
Mastering Left vs Right Skewed Histogram
As we conclude our comprehensive exploration of a left vs right skewed histogram, it’s crucial to recap the key points and underscore the importance of understanding skewness in data analysis.
Throughout this article, we’ve delved into the fundamental differences between a left vs right skewed histogram, examining their characteristics, implications, and real-world applications. We’ve learned that:
- Left-skewed distributions have tails extending to the left, with data clustered on the right
- Right-skewed distributions have tails extending to the right, with data clustered on the left
- The relationship between mean, median, and mode differs in skewed left or right distributions
- Skewness significantly impacts statistical analyses, financial assessments, and social science research
Recognizing and addressing skewness in your datasets is paramount for accurate interpretation and decision-making.
Whether you’re analyzing stock returns, survey responses, or scientific measurements, understanding the nuances of skewed data will enhance the validity of your conclusions.
For mastery of complex statistical concepts, Six Sigma Black Belt certification delves into advanced skewness applications in enterprise-level analytics.
As you move forward in your data analysis journey, we encourage you to apply this knowledge to your own datasets.
Remember, the key to mastering the concept of skewed right vs skewed left histograms lies in practice and real-world application.
SixSigma.us offers both Live Virtual classes as well as Online Self-Paced training. Most option includes access to the same great Master Black Belt instructors that teach our World Class in-person sessions. Sign-up today!
Virtual Classroom Training Programs Self-Paced Online Training Programs