Understanding the Difference: Standard Error vs. Standard Deviation
In the world of statistics, two terms often cause confusion and debate among researchers, data analysts, and students alike: standard error and standard deviation.
While they may sound similar, these statistical measures play distinct roles in data analysis and interpretation.
Understanding the difference between a standard error vs standard deviation is not just an academic exercise — it’s a crucial skill for anyone working with data, from business analysts to scientific researchers.
Key Highlights
- Concepts of standard error and standard deviation
- How to use them effectively in your data analysis
- Clearly define and distinguish between standard error and standard deviation
- Calculate both measures with confidence
- Choose the appropriate measure for your specific data analysis needs
- Interpret and communicate your findings accurately
- Avoid common misconceptions and pitfalls in statistical reporting
Mastering analytical skills in process improvement is supported by Six Sigma certification, which offers structured training in statistical methods.
Defining Standard Error and Standard Deviation
To understand the difference between a standard error vs standard deviation, we must first define each concept clearly.
These two statistical measures are often confused, but they serve distinct purposes in data analysis.
What is Standard Deviation?
Standard deviation (SD) is a fundamental concept in statistics that measures the spread or dispersion of data points in a dataset.
It answers the question: “How much do individual data points typically deviate from the mean?“
- Definition: The average distance between each data point and the mean of a dataset.
- Purpose: To quantify variability within a single sample or population.
- Formula: SD = √[Σ(x – μ)² / N], where x is each value, μ is the mean, and N is the number of values.
The standard deviation formula may seem complex, but its interpretation is straightforward.
A larger SD indicates more spread-out data, while a smaller SD suggests data clustered closely around the mean.
Visual representation: Imagine plotting height data for a population on a graph. The resulting bell curve’s width is determined by the standard deviation.
A narrow, tall curve indicates low variability (small SD), while a wide, flatter curve suggests high variability (large SD).
Example: In a study of adult heights, if the mean height is 170 cm with an SD of 10 cm, approximately 68% of adults would fall between 160 cm and 180 cm (within one SD of the mean).
What is Standard Error?
Standard error (SE), often referred to as the standard error of the mean, is a measure of the precision of a sample statistic, typically the sample mean.
- Definition: The standard deviation of the sampling distribution of a statistic.
- Purpose: To estimate how much sample means would vary if we repeated the sampling process many times.
- Formula: SE = SD / √n, where SD is the standard deviation of the sample and n is the sample size.
The standard error formula reveals a crucial relationship: as sample size increases, the standard error decreases, indicating more precise estimates.
Visual representation: If we plotted the means of multiple samples from the same population, the resulting distribution would be the sampling distribution.
The standard error determines the spread of this distribution.
Example: When estimating average income from sample data, an SE of $1,000 suggests that if we repeated our sampling process, most sample means would fall within $1,000 of the true population mean.
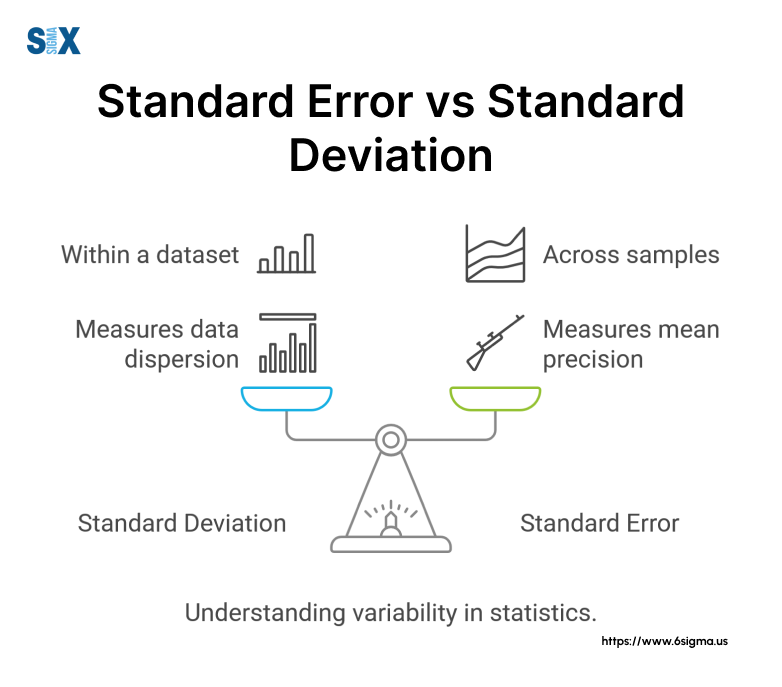
Understanding the difference between a standard error vs standard deviation is crucial for accurate data interpretation.
While SD measures variability within a dataset, SE estimates the precision of a sample statistic.
This distinction becomes particularly important when deciding which measure to use in your analysis and reporting.
Want to elevate your statistical skills? Our Yellow Belt course provides essential tools to navigate complex data analysis with confidence.
The Relationship Between Standard Error and Standard Deviation
Understanding the relationship between a standard error vs standard deviation is crucial for anyone working with statistical data.
While these two measures are distinct, they are closely related, and their connection provides valuable insights into data analysis and interpretation.
Mathematical Relationship
The standard error (SE) and standard deviation (SD) are linked by a simple yet powerful formula:
SE = SD / √n
Where:
- SE is the standard error
- SD is the standard deviation
- n is the sample size
This formula reveals the fundamental relationship between standard error vs standard deviation.
It shows that the standard error is always smaller than the standard deviation, except when the sample size is 1, in which case they are equal.
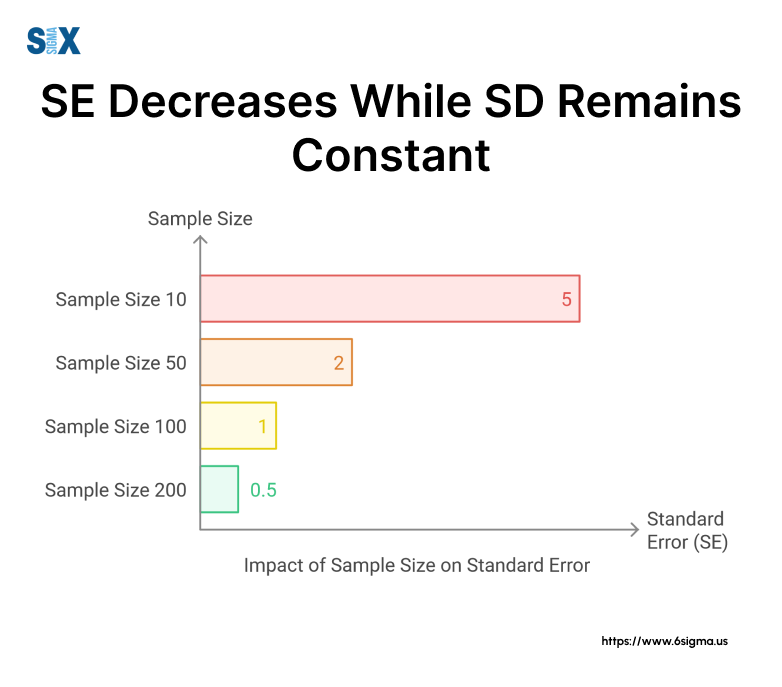
Impact of Sample Size
The relationship between standard error and standard deviation is profoundly influenced by sample size:
- As sample size increases, the standard error decreases.
- The standard deviation remains relatively constant regardless of sample size.
This difference is critical when considering what is standard error vs standard deviation in practical applications.
While SD measures the spread of individual data points, SE estimates how precisely the sample mean represents the population mean.
Visual Representation
Imagine plotting both SE and SD against increasing sample sizes:
- The SD line would remain relatively flat.
- The SE line would start at the same point as SD (when n=1) but would curve downward as n increases.
This visual highlights a key point: standard error decreases as sample size increases, while standard deviation remains stable.
Example: Effect of Sample Size
Let’s consider a population with a standard deviation of 10:
- Sample size of 4: SE = 10 / √4 = 5
- Sample size of 16: SE = 10 / √16 = 2.5
- Sample size of 100: SE = 10 / √100 = 1
As we can see, increasing the sample size dramatically reduces the standard error, improving our estimate’s precision.
Understanding this relationship is crucial when deciding when to use standard error vs standard deviation.
For instance, when reporting research findings, using SE can help communicate the precision of your sample mean estimate, while SD describes the variability within your dataset.
To further explore this relationship, try our interactive calculator:
This tool allows you to input different standard deviations and sample sizes to see how they affect the standard error, helping you visualize the relationship between standard error and standard deviation in real-time.
When to Use Standard Error vs Standard Deviation
Understanding when to use standard error vs standard deviation is crucial for accurate data analysis and interpretation.
While these two statistical measures are related, they serve different purposes and are appropriate in distinct scenarios.
Appropriate Use Cases for Standard Deviation
Standard deviation (SD) is primarily used when:
- Describing variability in a dataset: SD provides a measure of how spread out the data points are from the mean.
- Identifying outliers: Data points that fall outside 2-3 standard deviations from the mean are often considered outliers.
- Quality control applications: In manufacturing, SD helps monitor process consistency.
- Comparing datasets: SD allows for meaningful comparisons of variability between different datasets.
Example: Manufacturing Process Variability
Imagine a pharmaceutical company producing tablets. The ideal weight is 500mg, with an acceptable range of ±20mg. By calculating the SD of tablet weights, quality control can determine if the production process is consistent:
- SD = 5mg: 95% of tablets fall within 490-510mg (good consistency). This application of statistical analysis is central to methodologies like Six Sigma, which focus on reducing process variability to enhance quality.
- SD = 15mg: Only 68% of tablets fall within 485-515mg (poor consistency)
In this case, using standard deviation helps assess product quality and process stability.
Appropriate Use Cases for Standard Error
Standard error (SE) is typically used when:
- Estimating population parameters: SE helps quantify the precision of sample statistics as estimates of population parameters.
- Constructing confidence intervals: SE is crucial in determining the range within which the true population parameter likely falls.
- Hypothesis testing: SE is used in calculating test statistics for various statistical tests.
- Reporting research findings: SE communicates the reliability of sample means in representing the population mean.
Example: Political Polling Accuracy
Consider a political poll estimating voter preferences. If a candidate’s support is reported as 52% with a standard error of 3%, we can interpret this as:
- The best estimate of the candidate’s true support in the population is 52%.
- There’s a 68% chance that the true population support falls within 49-55% (±1 SE).
- There’s a 95% chance that the true population support falls within 46-58% (±2 SE).
In this scenario, using standard error provides insights into the precision of the poll’s estimate.
Comparison Table: Standard Error vs Standard Deviation
| Aspect | Standard Deviation | Standard Error |
|---|---|---|
| Measures | Variability within a dataset | Precision of sample mean estimate |
| Formula | √[Σ(x – μ)² / N] | SD / √n |
| Affected by sample size | No | Yes (decreases as n increases) |
| Used for | Describing data spread | Inferential statistics |
| Typical applications | Quality control, data description | Confidence intervals, hypothesis testing |
Decision Tree: Choosing Between SE and SD
- Are you describing variability within a single dataset?
• Yes → Use Standard Deviation
• No → Continue - Are you estimating a population parameter from a sample?
• Yes → Use Standard Error
• No → Continue - Are you conducting hypothesis tests or constructing confidence intervals?
• Yes → Use Standard Error
• No → Continue - Are you comparing the spread of multiple datasets?
• Yes → Use Standard Deviation
• No → Reassess your statistical needs
Understanding when to use standard error vs standard deviation is essential for accurate data analysis and interpretation.
By considering the nature of your data and your analytical goals, you can choose the appropriate measure to support your research or decision-making process.
Common Misconceptions and Errors
Despite their importance in statistical analysis, standard error (SE) and standard deviation (SD) are often misunderstood and misused.
Interchangeable Use in Research Papers
One of the most prevalent misconceptions is that standard error and standard deviation are interchangeable.
This error often appears in research papers, where authors might use SE when they should use SD, or vice versa.
- Misconception: SE and SD represent the same thing and can be used interchangeably.
- Reality: SE measures the precision of the sample mean, while SD measures the variability within the dataset.
To avoid this error, always clarify which measure you’re using and why. Remember, when describing the variability of your data, use SD.
When discussing the precision of your sample mean estimate, use SE.
Misinterpretation in Data Visualization
Another common error occurs in data visualization, particularly with error bars. Many researchers and readers misinterpret what these bars represent.
- Misconception: Error bars always represent standard deviation.
- Reality: Error bars can represent SD, SE, confidence intervals, or other measures of variability.
When creating or interpreting graphs with error bars, always specify what the bars represent. Are you using standard error vs standard deviation error bars? Make it clear in your figure legend.
Confusion in Reporting Results
Confusion often arises when reporting results, especially when discussing means and their associated variability.
- Misconception: The “plus or minus” value after a mean is always the standard deviation.
- Reality: This value could be SD, SE, or a confidence interval.
When reporting results, always explicitly state whether you’re using standard error vs standard deviation of the mean. For example, “The mean score was 75 ± 5 (SD)” or “The mean score was 75 ± 2 (SE)”.
Understanding these common misconceptions about standard error vs standard deviation is crucial for accurate data analysis and reporting. Addressing such errors often requires techniques taught in root cause analysis training, which equips professionals to systematically identify and resolve data integrity issues.
Always be clear about which measure you’re using and why, and don’t hesitate to provide explanations in your work to help your audience interpret your results correctly.
Eliminate statistical errors and misconceptions. Our Statistical Process Control course empowers you to implement robust data analysis systems for continuous improvement.
Conclusion
As we wrap up our exploration of standard error vs standard deviation, it’s crucial to recap the key differences and emphasize the importance of choosing the right measure for accurate data interpretation.
Standard deviation (SD) and standard error (SE) are distinct statistical concepts, each serving a unique purpose in data analysis:
- Standard Deviation measures the spread of individual data points within a dataset.
- Standard Error quantifies the precision of a sample mean as an estimate of the population mean.
Understanding when to use standard error vs standard deviation is vital for accurate data analysis and reporting.
While SD is used to describe variability within a sample, SE is employed in inferential statistics to estimate population parameters.
The relationship between standard error and standard deviation is intrinsically linked to sample size. As sample size increases, SE decreases, while SD remains relatively stable. This relationship is crucial when interpreting research findings and assessing the reliability of estimates.
We encourage you to apply these concepts in your real-world data analysis scenarios. Whether you’re a student, researcher, or professional analyst, the correct use of SE and SD will enhance the accuracy and credibility of your statistical reporting.
This article will help you make informed decisions about which measure to use in various analytical situations.
Remember, the choice between standard error and standard deviation isn’t about which is better, but rather which is more appropriate for your specific analytical needs.
By mastering these concepts, you’re equipping yourself with powerful tools for data interpretation and decision-making. Those looking to apply these skills in organizational settings can explore Six Sigma certification to formalize their expertise in statistical process improvement.
SixSigma.us offers both Live Virtual classes as well as Online Self-Paced training. Most option includes access to the same great Master Black Belt instructors that teach our World Class in-person sessions. Sign-up today!
Virtual Classroom Training Programs Self-Paced Online Training Programs


