Common Cause vs Special Cause Variation: A Guide to Process Control
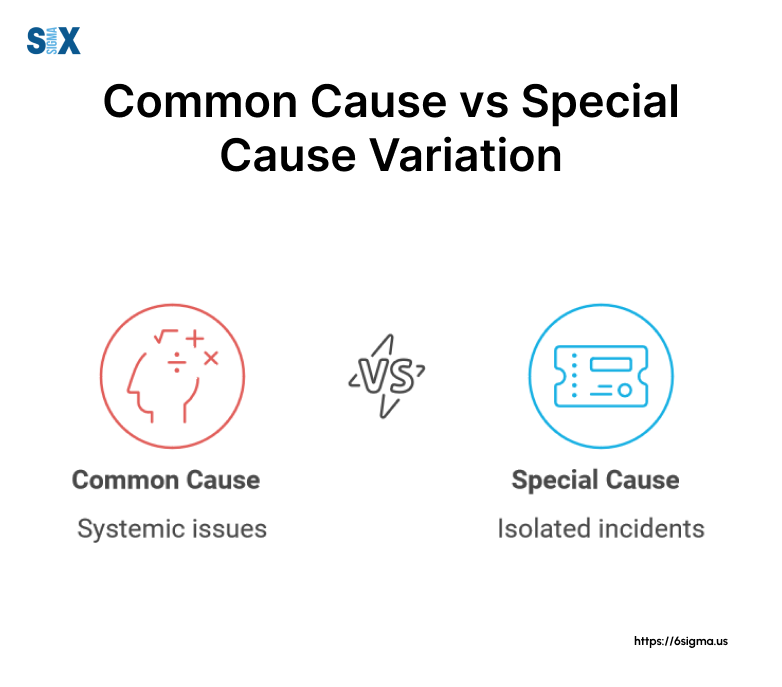
In the world of quality management, not all variations are created equal. Understanding the difference between a common cause vs special cause variation is crucial for effective process control and continuous improvement.
This comprehensive guide will breakdown the common cause vs special cause variation, providing actionable insights for professionals in quality management, process improvement, and project management who may be pursuing or considering six sigma certification.
Key Highlights
- Defining variation types
- Identification methods
- Management strategies
- Common misconceptions addressed
- Statistical techniques explained
- Future of process control
- AI in variation detection
Understanding Variation in Process Control
In the world of process control and quality management, variation is the heartbeat of improvement.
Managers must learn to interpret variation in their processes.
This understanding is fundamental to distinguishing between common cause and special cause variation, the cornerstones of effective quality control.

Definition of Variation in Quality Control
Variation, in quality control terms, refers to the inevitable differences between products or process outcomes.
It’s the subtle (or sometimes not-so-subtle) deviations from the ideal that occur in any repetitive process.
Think of it as the fingerprint of your process – unique, ever-present, and telling a story about the health of your operations.
The Importance of Identifying Causes of Variation
Identifying the causes of variation is akin to solving a mystery in your process. It’s not just about spotting differences; it’s about understanding their origins.
This knowledge is crucial because it dictates your response strategy. Misdiagnosing the type of variation can lead to unnecessary adjustments or, worse, ignoring critical issues.
Historical Context: Shewhart, Deming, and the Evolution of Statistical Process Control
The story of variation in quality control is incomplete without mentioning Walter Shewhart and W. Edwards Deming.
Shewhart, often called the father of statistical quality control, developed the concept of control charts in the 1920s.
These charts revolutionized the way we visualize and understand process variation.
Deming, Shewhart’s protégé, took these concepts further, emphasizing the importance of understanding variation in management.
His work in post-war Japan demonstrated how proper management of variation could lead to dramatic improvements in quality and productivity.
Real-World Application
Consider the case of a semiconductor manufacturer struggling with inconsistent chip performance.
By implementing Shewhart’s control charts, they identified patterns in their process variation.
This led to the discovery of a subtle equipment calibration issue – a common cause of variation. Addressing this improved their yield by 15% and reduced customer complaints by 30%.
Such practical applications of statistical tools are a key focus in six sigma green belt certification.
Six Sigma Connection:
In Six Sigma methodology, understanding variation is crucial for the Define and Measure phases of DMAIC (Define, Measure, Analyze, Improve, Control).
Tools like control charts and process capability analysis are used to quantify and visualize variation, setting the stage for improvement efforts.
Practical Tips:
- Start by gathering data on your key processes.
- Use control charts to visualize variation over time.
- Look for patterns – are the variations consistent or erratic?
- Involve operators in discussions about process variation – they often have valuable insights.

Key Takeaways:
- Variation is inherent in all processes and understanding it is key to improvement.
- Identifying the causes of variation determines the appropriate management response.
- Historical figures like Shewhart and Deming laid the groundwork for modern variation management.
- Six Sigma tools provide structured approaches to analyzing and managing variation.
Common Cause Variation: The “Normal” Noise
As we delve deeper into the world of process control, we encounter the first of our two main characters: common cause variation.
This ever-present aspect of any process is like the background hum in a busy office – always there, largely predictable, and a natural part of the system.
Definition and Characteristics of Common Cause Variation
Common cause variation, also known as random or natural variation, represents the inherent fluctuations in a process that occur even when it’s operating under stable conditions.
It’s the result of numerous small, unidentifiable factors that collectively create a consistent pattern of variation.
Imagine you’re brewing coffee every morning. Despite using the same machine, beans, and water, the taste might vary slightly from day to day.
These minor differences are examples of common cause variation – they’re expected and fall within a predictable range.
Examples of Common Cause Variation Across Industries
Common cause variation isn’t limited to manufacturing; it’s ubiquitous across all sectors:
- Manufacturing: Minor fluctuations in product dimensions due to normal wear of machine parts.
- Service Industry: Slight variations in customer service call durations.
- Healthcare: Small differences in patient recovery times for similar procedures.
- Project Management: Minor deviations in task completion times for routine activities.
The Role of Common Cause Variation in Establishing Process Stability
Understanding common cause variation is crucial for establishing and maintaining process stability. It sets the baseline for what’s “normal” in your process, allowing you to:
- Set realistic expectations for process performance
- Avoid overreacting to minor fluctuations
- Identify when special cause variation occurs
Real-World Application:
A logistics company was struggling with inconsistent delivery times.
By analyzing their data, they identified that variations of up to 30 minutes were due to common causes like traffic patterns and package sizes.
This understanding helped them set more accurate delivery promises and improve customer satisfaction.
Six Sigma Connection:
In Six Sigma, common cause variation is addressed during the Control phase of DMAIC.
Tools like Statistical Process Control (SPC) charts help monitor processes to ensure they remain within expected common cause variation limits.
Practical Tips:
- Collect data over time to establish your process’s normal range of variation.
- Use control charts to visualize common cause variation patterns.
- Educate team members about common cause variation to prevent overreaction to normal fluctuations.
- Focus on system-wide improvements to reduce common cause variation, rather than addressing individual data points.

Key Takeaways:
- Common cause variation is natural, expected, and inherent in all processes.
- It results from numerous small factors and creates a consistent pattern of variation.
- Understanding common cause variation is crucial for setting realistic expectations and identifying abnormalities.
- Reducing common cause variation often requires system-wide improvements rather than quick fixes.
Special Cause Variation: The Unexpected Disruptor
While common cause variation is the steady heartbeat of your process, special cause variation is the sudden arrhythmia that demands immediate attention.
As we shift our focus to this disruptive force, we’ll explore how it can impact your operations and why distinguishing it from common cause variation is crucial for effective process management.
Definition and Characteristics of Special Cause Variation
Special cause variation, also known as assignable cause variation, refers to unusual fluctuations in a process that are caused by specific, identifiable factors outside the normal system.
Unlike the predictable nature of common cause variation, special cause variation is characterized by:
- Unpredictability: It occurs sporadically and doesn’t follow a consistent pattern.
- Significance: The variation often falls outside the expected range of process performance.
- Identifiability: There’s usually a specific, traceable reason for the variation.
Think of special cause variation as the unexpected thunderstorm in your otherwise predictable weather pattern. It’s an outlier that signals something unusual is affecting your process.
Real-World Examples of Special Cause Variation
Special cause variation can manifest in various ways across different industries:
- Manufacturing: A machine breakdown causing a sudden spike in defect rates.
- Healthcare: An unusually high infection rate due to a contaminated batch of medical supplies.
- Customer Service: A significant increase in call volumes following a product recall.
- Data Science: Unexpected anomalies in data patterns due to a cyber attack.
- AI and Machine Learning: Sudden drops in model accuracy due to changes in input data sources.
The Impact of Special Cause Variation on Process Performance
Unaddressed special cause variation can have severe consequences:
- Quality Issues: It can lead to defects, errors, and inconsistencies in output.
- Cost Increases: Addressing the aftermath of special cause variation often incurs additional expenses.
- Customer Dissatisfaction: Unexpected variations can lead to unmet expectations and lost business.
- Misguided Improvement Efforts: Mistaking special cause for common cause variation can result in unnecessary process changes.
Real-World Application:
A semiconductor manufacturer noticed a sudden increase in chip failures.
Investigation revealed a special cause: a new employee had inadvertently changed a critical machine setting.
By identifying and correcting this issue, they prevented a potential loss of $500,000 in defective products.
Six Sigma Connection:
In Six Sigma, special cause variation is often addressed during the Analyze and Improve phases of DMAIC.
Root Cause Analysis tools like the 5 Whys and Fishbone Diagrams are commonly used to identify the sources of special cause variation.
Practical Tips:
- Implement a robust data collection and monitoring system to quickly detect special cause variation.
- Train your team to distinguish between common and special cause variation.
- Develop a response plan for when special cause variation is detected.
- Regularly review and update your list of potential special causes as your process evolves.
Key Takeaways:
- Special cause variation is unpredictable, significant, and has identifiable sources.
- It can occur in any industry and often requires immediate attention.
- Unaddressed special cause variation can lead to quality issues, increased costs, and customer dissatisfaction.
- Quick identification and response to special cause variation is crucial for maintaining process stability.
Now that we’ve explored both common and special cause variation, you might be wondering: “How do I tell them apart in practice?“
Below explained are the methods and tools for distinguishing between these two types of variation, equipping you with the skills to become a variation detective in your own processes.
Distinguishing Between Common Cause and Special Cause Variation
As we’ve explored the characteristics of common cause and special cause variation, the next crucial step is learning how to differentiate between them.
This skill is the cornerstone of effective process management and quality control.
Here’s a comprehensive comparison table to highlight the key differences between common cause and special cause variation:
| Aspect | Common Cause Variation | Special Cause Variation |
|---|---|---|
| Definition | Natural, inherent process variation | Unusual, identifiable external factors |
| Predictability | Consistent and foreseeable | Unpredictable and sporadic |
| Pattern on Control Chart | Within control limits, random distribution | Outside control limits or non-random patterns |
| Frequency | Occurs constantly | Occurs occasionally |
| Impact on Process | Minor, expected fluctuations | Significant deviations from norm |
| Identification Method | Statistical process control, control charts | Root cause analysis, Pareto charts |
| Management Approach | System-wide improvements | Specific, targeted interventions |
| Example | Minor fluctuations in product weight | Sudden spike in defects due to equipment failure |
| Six Sigma Phase | Control | Analyze and Improve |
Statistical Methods for Identification
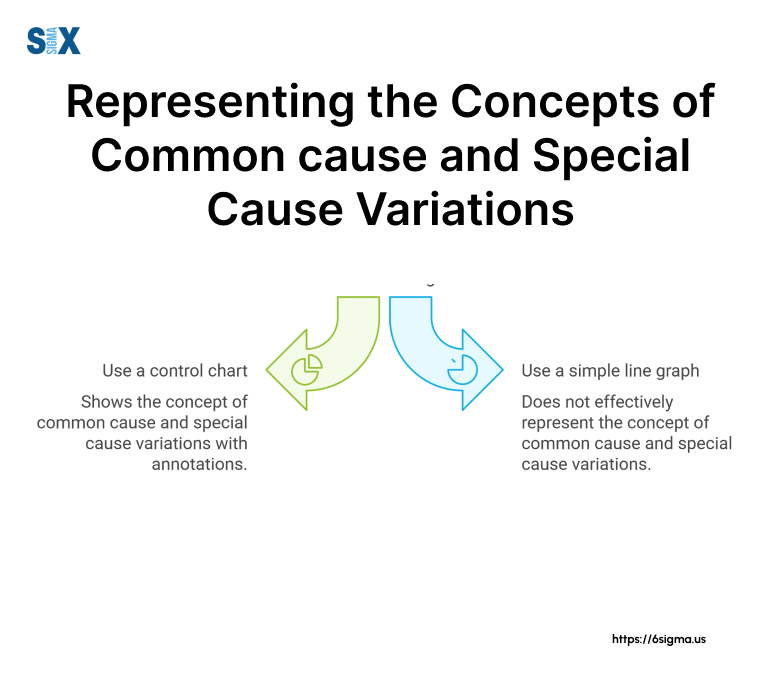
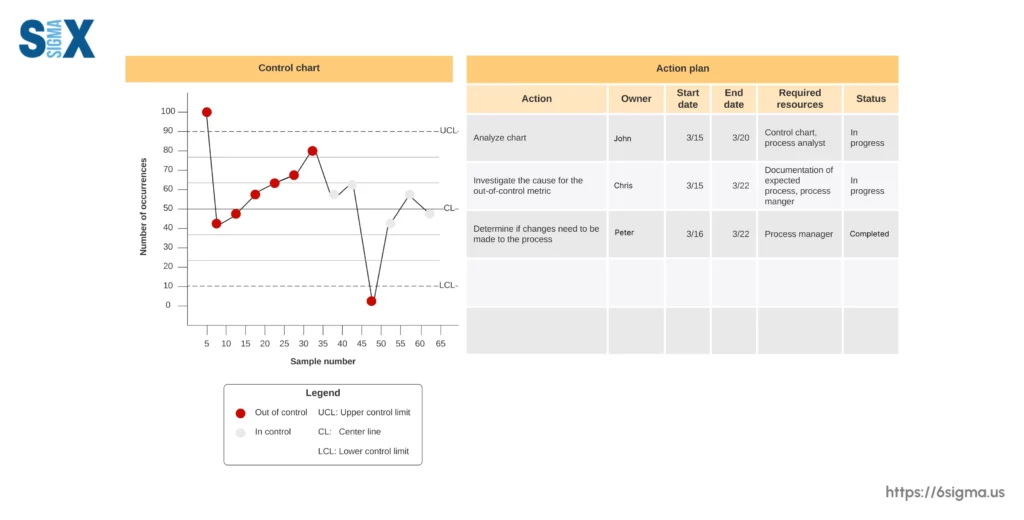
The primary statistical tool for distinguishing between common and special cause variation is the control chart.
This powerful visual aid plots process data over time and includes calculated control limits.
Points falling within these limits and showing random patterns typically indicate common cause variation, while points outside the limits or displaying non-random patterns suggest special cause variation.
The Role of Control Charts in Variation Analysis
Control charts are the gold standard for variation analysis. They provide a real-time visual representation of your process, allowing you to:
- Establish a baseline for normal process behavior
- Quickly identify when special causes occur
- Monitor the impact of process improvements over time
Common Misconceptions and Pitfalls
Beware of these common traps when analyzing variation:
- Overreaction to common cause variation: Not every fluctuation requires action.
- Underreaction to special cause variation: Ignoring significant deviations can lead to major issues.
- Misinterpreting short-term patterns: Sometimes, random chance can create patterns that look like special causes.
AI and Machine Learning in Variation Detection
As processes become more complex, AI and machine learning are emerging as powerful tools for variation analysis:
- Pattern Recognition: AI can detect subtle patterns that might escape human observation.
- Predictive Analytics: Machine learning models can forecast potential special causes before they occur.
- Real-time Monitoring: AI-powered systems can continuously analyze data streams, providing instant alerts for special cause variation.
Advanced statistical methods, often explored through Six Sigma Black Belt certification, play a key role in strengthening process improvement initiatives.
Six Sigma Connection
In Six Sigma, the ability to distinguish between common and special cause variation is crucial in the Analyze phase of DMAIC.
It guides whether to make fundamental process changes or address specific, assignable causes.
Key Takeaways:
- Control charts are the primary tool for distinguishing between common and special cause variation.
- Misinterpretation of variation types can lead to ineffective or harmful interventions.
- Advanced AI and machine learning techniques are enhancing our ability to detect and predict variation.
- Combining statistical tools with process knowledge is key to accurate variation analysis.
Management Strategies for Common Cause and Special Cause Variation
Effective management of both types of variation is crucial for process improvement and maintaining a competitive edge.
Approaches to Reducing Common Cause Variation
Managing common cause variation requires a systematic approach to harmonize all elements of your process.
Here are some key strategies:
- Process Standardization: Develop and implement standard operating procedures (SOPs) to reduce variability in how tasks are performed.
- Employee Training: Invest in comprehensive training programs to ensure all team members understand and follow best practices.
- Equipment Maintenance: Implement preventive maintenance schedules to keep machinery operating at optimal levels.
- Supplier Quality Management: Work closely with suppliers to ensure consistency in input materials or services.
- Statistical Process Control (SPC): Utilize SPC tools to monitor processes and identify trends that may indicate increasing common cause variation.
Techniques for Addressing Special Cause Variation
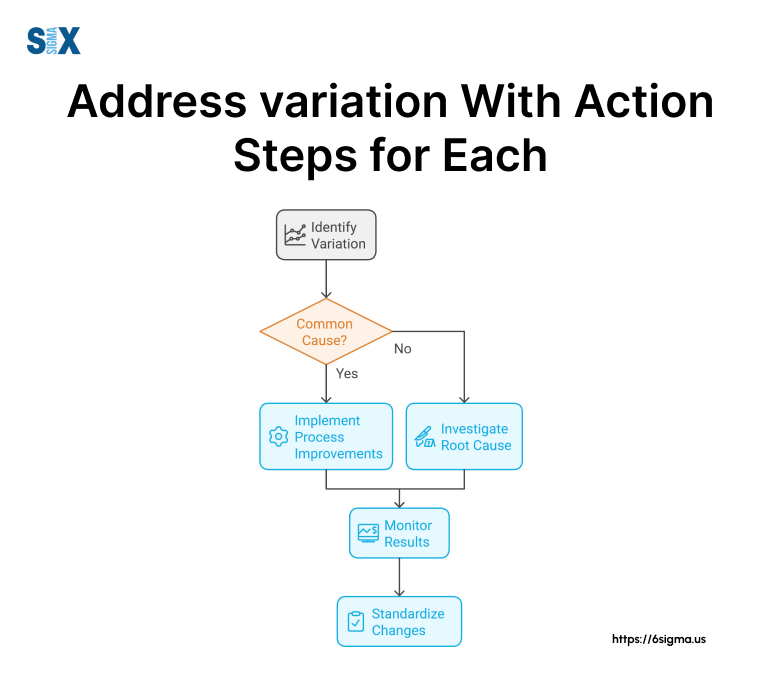
Dealing with special cause variation is more like detective work – you need to investigate, identify, and eliminate the root cause. Here’s a framework to guide your efforts:
- Rapid Response: Develop a system for quick identification and reaction to special cause variation.
- Root Cause Analysis: Use tools like the 5 Whys or Fishbone Diagrams to uncover the underlying causes of variation. For those looking to deepen their skills in this area, root cause analysis training can provide structured methodologies and practical techniques.
- Corrective Action Planning: Once the cause is identified, develop and implement a plan to address it and prevent recurrence.
- Verification: After implementing corrective actions, monitor the process to ensure the special cause has been effectively eliminated.
- Knowledge Sharing: Document lessons learned and share them across the organization to prevent similar issues in other areas.
Six Sigma Connection:
In Six Sigma, variation management is integral to the DMAIC (Define, Measure, Analyze, Improve, Control) methodology.
Tools like Control Charts (for monitoring common cause variation) and Failure Mode and Effects Analysis (FMEA) (for predicting potential special causes) are commonly used in variation management efforts.
Practical Tips:
- Start small: Begin with pilot projects to demonstrate the value of variation management.
- Celebrate successes: Recognize and reward teams that effectively reduce variation.
- Use visual management: Implement dashboards or scorecards to make variation visible to all.
- Regular review: Schedule periodic assessments of your variation management strategies.

Conclusion
As we conclude our exploration of common cause and special cause variation, it’s clear that understanding these concepts is not just an academic exercise, but a crucial skill for any professional involved in process management, quality control, or continuous improvement initiatives.
Throughout this article, we’ve journeyed from the foundational definitions of common and special cause variation to the practical strategies for identifying and managing them.
We’ve seen how these concepts, rooted in the work of pioneers like Shewhart and Deming, continue to evolve and remain relevant.
Key Takeaways:
- Common cause variation represents the natural, inherent fluctuations in a process, while special cause variation stems from identifiable, often external factors.
- Distinguishing between these types of variation is crucial for effective process management and improvement.
- Tools like control charts are invaluable for identifying and monitoring both types of variation.
- Management strategies differ for common and special cause variation, with the former requiring system-wide improvements and the latter demanding targeted interventions.
The ability to recognize and appropriately respond to different types of variation can be the difference between a process that consistently delivers value and one that struggles with unpredictability and inefficiency.
The road ahead may have its challenges, but armed with the knowledge of common and special cause variation, you’re well-prepared to navigate the complexities of process management and lead your organization towards excellence.
Now, it’s time to put this knowledge into action.
What process in your organization will you analyze first? How will you apply these concepts to drive improvement?
The journey to mastering variation starts now – embrace it, and watch as your processes transform and your results soar.
SixSigma.us offers both Live Virtual classes as well as Online Self-Paced training. Most option includes access to the same great Master Black Belt instructors that teach our World Class in-person sessions. Sign-up today!
Virtual Classroom Training Programs Self-Paced Online Training Programs


