Mastering Relative Standard Deviation: A Complete Guide to Precision and Quality Control
Imagine you’re overseeing a critical production. Your team has just implemented a new process, and you need to assess its consistency.
This is where Relative Standard Deviation or RSD shines, providing a clear measure of variability that can make the difference between a successful product launch and a costly recall.
To ensure process consistency in such high-stakes scenarios, pursuing a six sigma certification can equip you with the skills to leverage tools like RSD effectively.
From Basic Concepts to Advanced Applications, We’ll Cover:
- The fundamentals of Relative Standard Deviation (RSD) and its importance in statistical analysis
- Step-by-step calculation methods, including manual and tool-assisted approaches
- Interpreting RSD values and avoiding common pitfalls
- Practical case studies from industry leaders
- Advanced applications in quality control and financial modeling
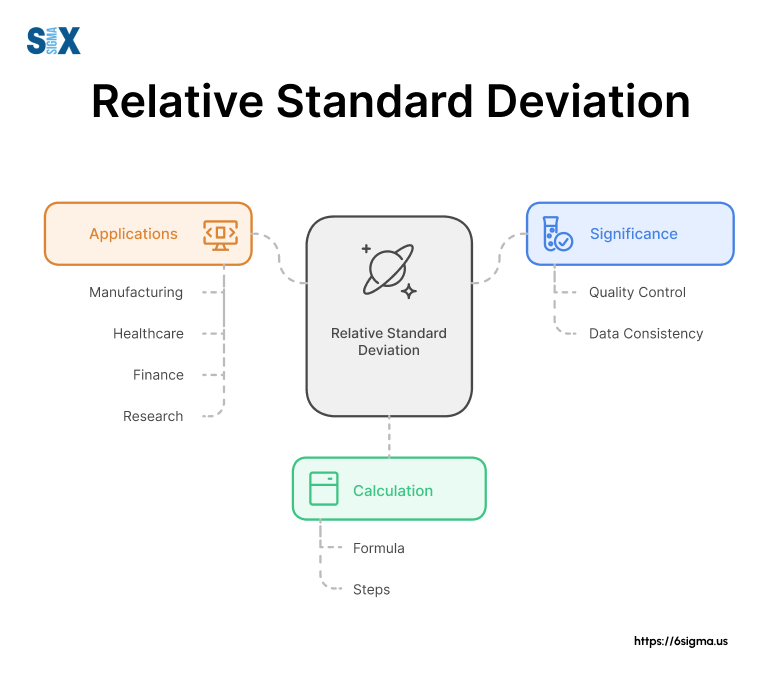
What is Relative Standard Deviation?
Relative Standard Deviation, or RSD helps measure the spread of numbers or observations in a set of data in the percentage format.
RSD is preferred owing to its versatility to compare different sets of data, even if they’re different things or have different averages.
In simpler terms, think of RSD as a way to gauge how tightly your data clusters around the average. It’s like measuring how well a team performs consistently, regardless of whether they’re scoring goals in soccer or points in basketball.
Master RSD and other critical statistical tools
Our Lean Six Sigma Green Belt certification covers essential techniques for process improvement and quality control.
When to Use Relative Standard Deviation (RSD)?
In my experience leading Six Sigma projects, I’ve found RSD to be invaluable in several scenarios:
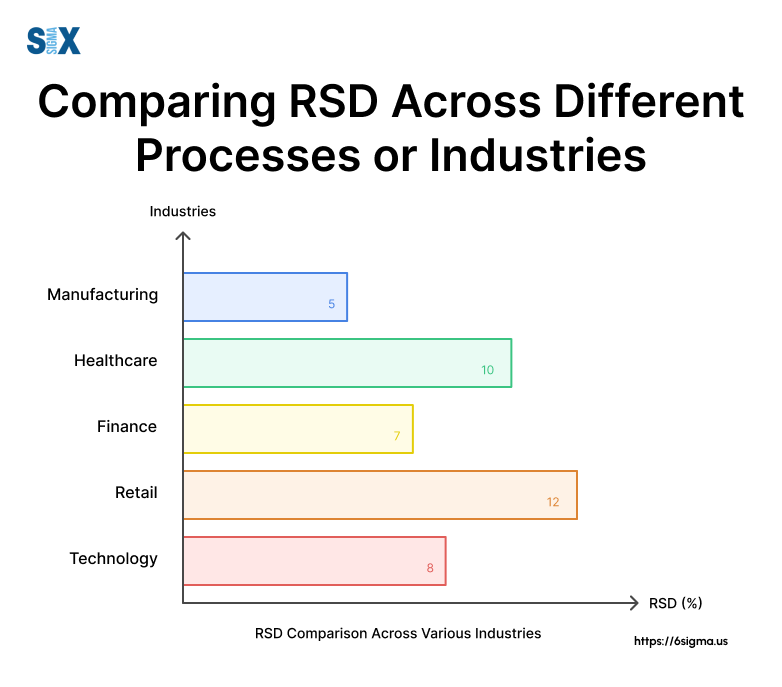
- Comparing variability across different processes or products
- Assessing the precision of analytical methods
- Monitoring manufacturing consistency over time
RSD shines when you need to compare the spread of data relative to its magnitude. For instance, when evaluating the consistency of two production lines with significantly different output volumes, RSD provides a fair comparison that standard deviation alone cannot offer.
Components of Relative Standard Deviation
To truly understand RSD, we need to break it down into its components:
- Standard Deviation: This measures the absolute spread of your data points.
- Mean: The average value of your dataset.
The relationship between these components is what gives RSD its power. By dividing the standard deviation by the mean and expressing it as a percentage, we create a relative measure that allows for meaningful comparisons across different scales and units.
In Six Sigma terms, RSD aligns closely with our focus on reducing variation and improving consistency. It’s a key tool in our Define and Measure phases, helping us quantify process performance and set clear improvement targets.
Mastering RSD, a critical tool in quality control, is a key component of six sigma certification programs, which train professionals to reduce variability and enhance process reliability.
The Relative Standard Deviation Formula
Now that we’ve laid the groundwork for understanding RSD, it’s time to roll up our sleeves and dive into the formula.
As a Six Sigma practitioner, I’ve found that mastering this formula is crucial for anyone looking to improve process consistency and quality control.
The Basic RSD Formula
The relative standard deviation formula is elegantly simple, yet powerful:
RSD = (Standard Deviation / Mean) × 100%
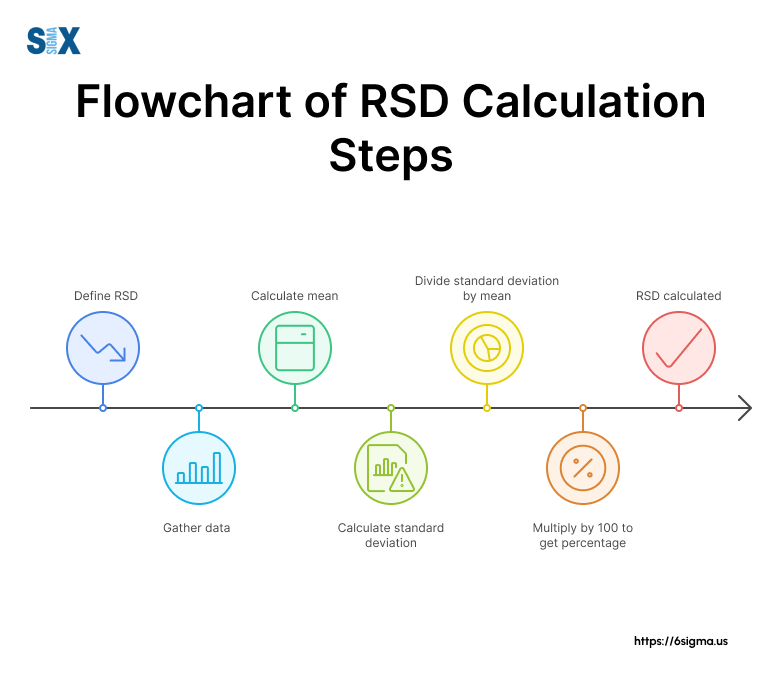
Let’s break this down:
- Calculate the standard deviation of your dataset
- Divide it by the mean of the same dataset
- Multiply by 100 to express it as a percentage
This formula transforms the absolute measure of spread (standard deviation) into a relative measure, allowing for meaningful comparisons across different scales.
Percent Relative Standard Deviation
In many industries, you’ll often hear about “percent relative standard deviation” or %RSD. Don’t let this term confuse you – it’s simply another way of expressing RSD, as our formula already gives us a percentage.
During my time at a large manufacturing firm, we frequently used %RSD to set quality control limits. For instance, a manufacturing process might have a target %RSD of less than 2%, indicating high consistency and precision.
Calculating Relative Standard Deviation: An Example
Let’s apply this to a real scenario I encountered. We were analyzing the thickness of adhesive coatings on a new product line. Our data set looked like this:
Thickness (mm): 0.15, 0.16, 0.14, 0.15, 0.17
- Calculate the mean: (0.15 + 0.16 + 0.14 + 0.15 + 0.17) / 5 = 0.154 mm
- Calculate the standard deviation: 0.0114 mm (using the standard deviation formula)
- Apply the RSD formula: (0.0114 / 0.154) × 100% = 7.4%
This 7.4% RSD told us that our coating process had room for improvement, leading to targeted interventions in our Six Sigma DMAIC process.
Six Sigma Connection
In Six Sigma, we often use RSD in the Measure and Analyze phases, and a six sigma certification provides hands-on training to apply these techniques in Gage R&R studies for reliable measurement systems.
A low RSD in these studies indicates a reliable measurement system, crucial for accurate process improvement.
Practical Tips
- Always consider the context when interpreting RSD. A 5% RSD might be excellent for one process but unacceptable for another.
- Use RSD alongside other measures like Cp and Cpk for a comprehensive view of process capability.
- When dealing with near-zero means, be cautious with RSD as it can become inflated.
Take your statistical and graphical analysis to the next level
Learn statistical methods and their applications in complex process improvement projects with our short course on Introduction to Statistics and Graphical Analysis.
Step-by-Step Guide to Calculating RSD
Now that we’ve explored the RSD formula, let’s dive into the practical aspect of calculating relative standard deviation.
Manual Calculation Method
While we often use software for complex calculations, understanding the manual process is essential for grasping the concept fully. Here’s a step-by-step guide:
- Calculate the Mean
- Add all your data points
- Divide by the number of data points
- Calculate Standard Deviation
- Subtract the mean from each data point
- Square these differences
- Find the average of these squared differences
- Take the square root of this average
- Apply the RSD Formula
- Divide the standard deviation by the mean
- Multiply by 100 to get the percentage
Let’s apply this to a scenario I encountered at a manufacturing plant:
Machine cycle times (seconds): 58, 62, 57, 60, 59
- Mean = (58 + 62 + 57 + 60 + 59) / 5 = 59.2 seconds
- Standard Deviation = 1.92 seconds (calculated using the steps above)
- RSD = (1.92 / 59.2) * 100 = 3.24%
This 3.24% RSD indicates relatively low variability in the machine’s cycle times.
Using Excel for Relative Standard Deviation (RSD) Calculation
In many Six Sigma projects, we deal with large datasets where manual calculations become impractical. Here’s how to leverage Excel:
- Enter your data in a column (e.g., A1:A100)
- Calculate mean: =AVERAGE(A1:A100)
- Calculate standard deviation: =STDEV.S(A1:A100)
- Calculate RSD: =(STDEV.S(A1:A100)/AVERAGE(A1:A100))*100
Pro Tip: Create a named range for your data to make formulas more readable and easier to update.
Online RSD Calculators
For quick calculations or when you don’t have Excel handy, online calculators can be lifesavers. Here are a few reliable options:
- GraphPad QuickCalcs
- Calculator.net
- EasyCalculation.com
Six Sigma Connection
In Six Sigma, we often use RSD calculations in the Measure and Analyze phases of DMAIC. It’s particularly useful in Measurement System Analysis (MSA) to assess the precision of our measurement systems.
Practical Tips
- Always double-check your manual calculations with Excel or an online calculator.
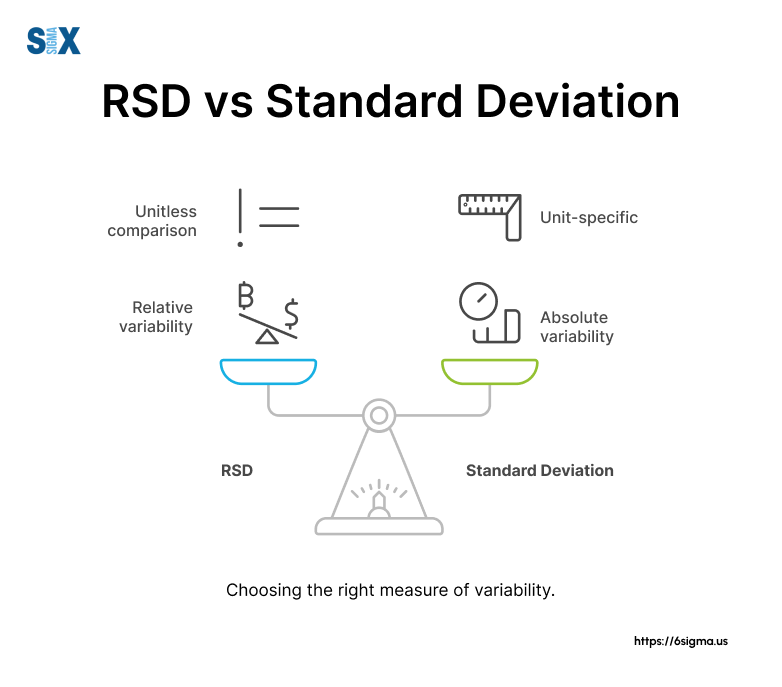
- When dealing with very large or very small numbers, be cautious of rounding errors.
- Remember, RSD is unit-less, making it perfect for comparing processes with different units of measurement.
Looking to implement RSD analysis and other Lean Six Sigma methodologies across your organization?
Our Lean Six Sigma Black Belt certification equips executives with the skills to drive data-driven decision-making and continuous improvement.
Applications of Relative Standard Deviation
Throughout my career, I’ve seen RSD transform decision-making processes across various industries. Six sigma certification helps employees master the RSD concept and apply it in their industry. Let’s dive into how this powerful tool can be applied to drive improvements and ensure quality.
Quality Control in Manufacturing
In manufacturing, consistency is king. RSD plays a crucial role in maintaining product quality and process stability. Here’s how:
- Process Capability Analysis
At a semiconductor plant I consulted for, we used RSD to assess the consistency of chip thickness. A low RSD indicated a stable process, while a high RSD signaled the need for intervention. - Batch-to-Batch Consistency
In pharmaceutical manufacturing, RSD helps ensure that each batch of medication has consistent potency. For instance, at a leading pharma company, we set an RSD threshold of 2% for active ingredient concentration. - Equipment Performance Monitoring
RSD can track the consistency of machine output over time. At an automotive parts manufacturer, we used RSD to identify when equipment needed maintenance or recalibration.
Financial Analysis and Risk Assessment with Relative Standard Deviation (RSD)
In the financial sector, RSD is a valuable tool for assessing volatility and risk:
- Portfolio Management
Investment managers use RSD to compare the volatility of different stocks or funds. A higher RSD indicates greater price fluctuations and potentially higher risk. - Economic Indicators
When analyzing economic data, such as GDP growth rates, RSD helps economists understand the stability of economic trends over time.
Environmental Science and Monitoring
RSD finds important applications in environmental studies:
- Pollution Monitoring
In a project with an environmental agency, we used RSD to assess the consistency of pollutant levels in air and water samples. A high RSD might indicate intermittent pollution sources that require investigation. - Climate Data Analysis
Climatologists use RSD to analyze temperature and precipitation patterns, helping to identify climate anomalies and trends.
Six Sigma Connection
In Six Sigma, we often use RSD in conjunction with other statistical tools during the Measure and Analyze phases of DMAIC. It’s particularly useful in Measurement System Analysis (MSA) and Process Capability Studies.
Practical Tips
- Always consider the context when interpreting RSD. What’s considered a “good” RSD varies by industry and application.
- Use RSD in combination with other metrics for a comprehensive analysis.
- When dealing with multiple processes or products, create a dashboard that tracks RSD over time for easy comparison.
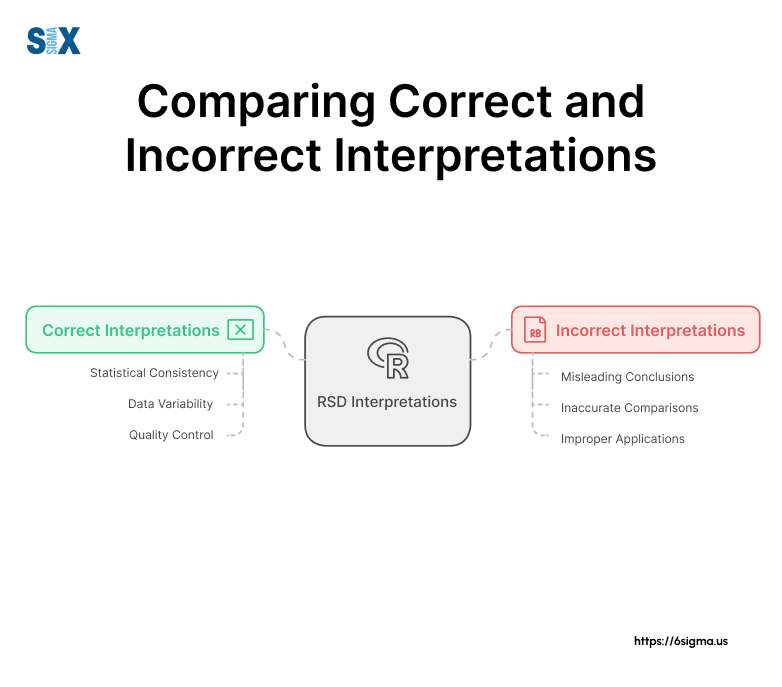
Common Mistakes and Misconceptions in RSD Interpretation
It’s crucial to address some common pitfalls I’ve encountered throughout my career. Misinterpreting RSD can lead to flawed decision-making, which is why understanding these potential errors is vital for any Six Sigma practitioner or data analyst.
Misinterpreting Relative Standard Deviation Values
One of the most frequent mistakes I’ve seen, even among experienced professionals, is the misinterpretation of RSD values:
- Assuming Lower is Always Better
While a low RSD often indicates consistency, it’s not always ideal. In a project at a food manufacturing plant, we found that an extremely low RSD in flavor compound concentration indicated a lack of complexity in the product’s taste profile. - Ignoring Context
RSD values should always be interpreted within the context of the process or industry. For instance, an RSD of 5% might be excellent for a chemical manufacturing process but unacceptable in pharmaceutical dosing. - Overlooking Scale
Remember, RSD is a relative measure. A 2% RSD on a large-scale process might represent more absolute variation than a 10% RSD on a smaller scale.
Confusing RSD with Other Measures
Another common issue is confusing RSD with related statistical measures:
- RSD vs. Standard Error
While both measure variability, standard error decreases with sample size, whereas RSD does not. This distinction is crucial when comparing datasets of different sizes. - RSD vs. Variance
Variance measures spread in squared units, while RSD is a unitless percentage. I once saw a project team mistakenly use variance instead of RSD, leading to incorrect process capability assessments.
Inappropriate Use of Relative Standard Deviation
Not every situation calls for RSD analysis:
- Data with Negative Values
RSD can’t be meaningfully calculated for datasets with both positive and negative values. In a financial analysis project, we had to use the coefficient of variation instead of RSD for datasets including both profits and losses. - Highly Skewed Data
For heavily skewed distributions, RSD can be misleading. In such cases, consider using robust measures of variability like the median absolute deviation.
Six Sigma Connection
In Six Sigma, we emphasize the importance of selecting the right statistical tool for each situation. The DMAIC framework, particularly in the Analyze phase, helps us critically evaluate our choice of metrics and their interpretation.
Practical Tips
- Always consider multiple measures of variability alongside RSD.
- When presenting RSD results, provide context and explain what the values mean for your specific process or industry.
- Use visualization tools like box plots or histograms to complement RSD analysis and provide a more complete picture of data distribution.
Advanced Topics in RSD
As we venture into more sophisticated applications of Relative Standard Deviation, we’ll explore how this versatile tool can be leveraged in complex analytical scenarios. Let’s see how mastering these advanced concepts can elevate a Six Sigma practitioner from good to exceptional.
RSD in Method Validation
Method validation is crucial in industries where precision and accuracy are paramount, such as pharmaceuticals and environmental testing. RSD plays a vital role here:
- Precision Assessment
In method validation, we use RSD to evaluate both repeatability (intra-day precision) and reproducibility (inter-day precision). For instance, when validating a new HPLC method for drug analysis at a pharmaceutical company, we set acceptance criteria of RSD ≤ 2% for intra-day precision and ≤ 3% for inter-day precision. - Accuracy Evaluation
RSD helps in assessing the consistency of accuracy across different concentration levels. In a recent project validating a water quality testing method, we used RSD to ensure that the method’s accuracy was consistent across low, medium, and high contaminant concentrations.
Pooled Relative Standard Deviation
Pooled RSD is a powerful tool when dealing with multiple sets of replicate measurements:
Definition: Pooled RSD combines the variability from multiple sets of measurements into a single RSD value.
Formula: RSDpooled = √[(RSD1^2 + RSD2^2 + … + RSDn^2) / n]
Application: I’ve used pooled RSD in multi-site studies to compare process variability across different manufacturing locations. It provides a comprehensive view of overall process consistency that individual RSDs can’t capture.
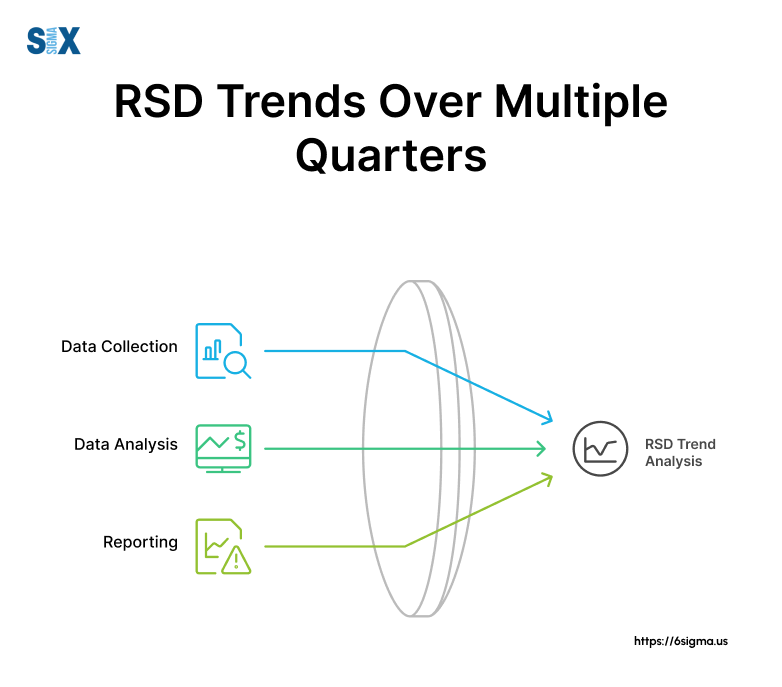
Relative Standard Deviation (RSD) in Time Series Analysis
RSD can offer valuable insights when analyzing data over time:
- Tracking Process Stability
By calculating RSD for rolling time windows, we can monitor how process variability changes over time. In a continuous manufacturing line at an electronics company, we used this technique to identify periods of increased variability, allowing for proactive interventions. - Seasonal Variability Assessment
RSD can help uncover seasonal patterns in variability. For example, in analyzing retail sales data, we found that RSD increased significantly during holiday seasons, indicating higher demand volatility.
Six Sigma Connection
These advanced RSD applications align closely with the Control phase of DMAIC, helping to establish robust monitoring systems for long-term process stability.
Practical Tips
- When using pooled RSD, ensure that the individual datasets are comparable in scale and nature.
- In time series analysis, consider using weighted RSD to give more importance to recent data points.
- Always validate your advanced RSD calculations with statistical software to ensure accuracy.
The Power of Relative Standard Deviation
It’s clear that this versatile tool is more than just a statistical measure – it’s a powerful lens through which we can view and improve our processes, products, and decisions.
From its fundamental concept to advanced applications, RSD has proven its worth across various industries and scenarios. We’ve seen how it can revolutionize quality control in manufacturing, enhance risk assessment in finance, and even contribute to environmental monitoring and cutting-edge data analysis.
The importance of RSD in Six Sigma and broader process improvement initiatives cannot be overstated. Its ability to provide a standardized measure of variability makes it an indispensable tool in our quest for consistency and excellence.
As you move forward, I encourage you to actively seek opportunities to apply RSD in your work. Whether you’re a project manager striving for process stability, a data analyst looking to extract meaningful insights, or a quality control specialist aiming for production excellence, RSD can be your ally in driving tangible improvements.
Remember, the true power of RSD lies not just in its calculation, but in its interpretation and application.
As a final thought, consider RSD as a compass in your data-driven journey. It points you towards areas of inconsistency and opportunity, guiding your improvement efforts and helping you navigate the complex landscape of process variation.
SixSigma.us offers both Live Virtual classes as well as Online Self-Paced training. Most option includes access to the same great Master Black Belt instructors that teach our World Class in-person sessions. Sign-up today!
Virtual Classroom Training Programs Self-Paced Online Training Programs