Mastering CUSUM Charts: The Key to Detecting Small Process Shifts
For processes where even slight variations carry major implications, promptly noticing and fixing minor shifts assumes critical priority, and this is where CUSUM charts come in play.
While common charts like Shewhart adequately track many scenarios, they can occasionally miss subtle process transformations.
This highlights the value of CUSUM charts. They provide a strong yet sensitive monitoring method, ensuring stability through small changes’ timely identification.
In this discussion, we explore CUSUM’s advantageous design. We’ll also profile some examples where CUSUM detection saved both quality and expenses.
My aim in sharing is to equip you to access CUSUM’s early warning intelligence.
So whether manufacturing, services, or elsewhere, consider optimizing deviation visibility within your domain. Timely issue illumination paves pathways to increased savings, satisfaction, and success.
Key Highlights
- Understanding the principle: Cumulative sum of deviations from target values
- Advantages over traditional Shewhart charts: Superior sensitivity to small process shifts
- Designing effective CUSUM charts: Choosing optimal parameters like reference value (k) and decision interval (h)
- Interpreting CUSUM signals: Identifying out-of-control conditions and root causes
- Integrating it with other SPC tools: EWMA charts, Shewhart charts, combined approaches
- Best practices and considerations: Training, data quality, process stability
- Limitations and alternatives: Large shift detection, non-normal distributions, specialized charts
- The future of process monitoring: Continuous improvement and evolving methodologies
Introduction to CUSUM Charts
Control charts have long been the go-to tool for quality professionals and engineers alike.
These powerful visualizations enable us to track process performance over time, detect abnormalities, and take corrective actions to maintain stability and consistency.
However, traditional control charts like the Shewhart charts can sometimes fall short when it comes to detecting small shifts in the process mean – and this is where CUSUM (Cumulative Sum) charts step in.
CUSUM charts are a specialized type of control chart designed specifically for monitoring small process shifts.
By cumulating the deviations of individual measurements or subgroup averages from a target value, these charts amplify the signal of even the most subtle process changes, making them an invaluable tool for industries where precision and tight process control are paramount.
Understanding the CUSUM Principle
At the core of CUSUM charts lies a simple yet powerful concept: the cumulative sum of deviations from a target value.
Unlike traditional control charts that analyze each data point independently, CUSUM charts incorporate information from both current and previous observations, effectively amplifying the signal of any process shifts or trends.
Advantages Of Shewhart Charts
While Shewhart charts are excellent at detecting large process shifts, their performance can be limited when it comes to identifying smaller, more gradual changes in the process mean.
This is where CUSUM charts truly excel, offering several key advantages:
Better small shift detection: By accumulating deviations over time, these charts are exquisitely sensitive to small process shifts, often detecting changes as small as 0.5 to 2 sigma from the target mean.
Average run length (ARL): CUSUM charts can be designed to optimize the average run length (ARL), which represents the average number of samples required to detect a specific shift in the process mean.
This allows for tailoring the chart’s sensitivity to match the practical needs of the process being monitored.
Sigma limits: Unlike Shewhart charts, which typically use three-sigma control limits, CUSUM charts employ decision intervals based on the desired ARL performance, providing greater flexibility and customization.
Designing an Effective CUSUM Chart
While the underlying principle is relatively straightforward, designing an effective chart requires careful consideration of several key parameters.
These parameters not only influence the chart’s sensitivity but also determine its ability to strike a balance between detecting genuine process shifts and avoiding false alarms.
Choosing Parameters for Optimal Performance
Two of the most critical parameters in the CUSUM chart design are the reference value (k) and the decision interval (h).
These values must be selected judiciously to ensure the chart’s performance aligns with the desired objectives:
Alpha and beta risks: The reference value (k) and decision interval (h) are often chosen based on the acceptable levels of alpha (false alarm) and beta (missed detection) risks, respectively.
Striking the right balance between these two risks is crucial for effective process monitoring.
Shift detection level: Another key consideration is the magnitude of the process shift you wish to detect quickly.
This shift, typically expressed as a multiple of the standard deviation (sigma), directly influences the selection of the reference value (k).
Vertex angle: In the visual representation of CUSUM charts (the V-Mask approach), the vertex angle of the V-shaped mask is determined by the chosen reference value (k) and decision interval (h).
This angle impacts the chart’s sensitivity and responsiveness to process shifts.
CUSUM Chart Construction
Once the design parameters have been established, the actual construction of a CUSUM chart can be approached through two primary methods: the tabular (algorithmic) method or the visual V-Mask method.
While both techniques serve the same purpose, each offers its own unique advantages and considerations.
Interpreting CUSUM Chart Signals
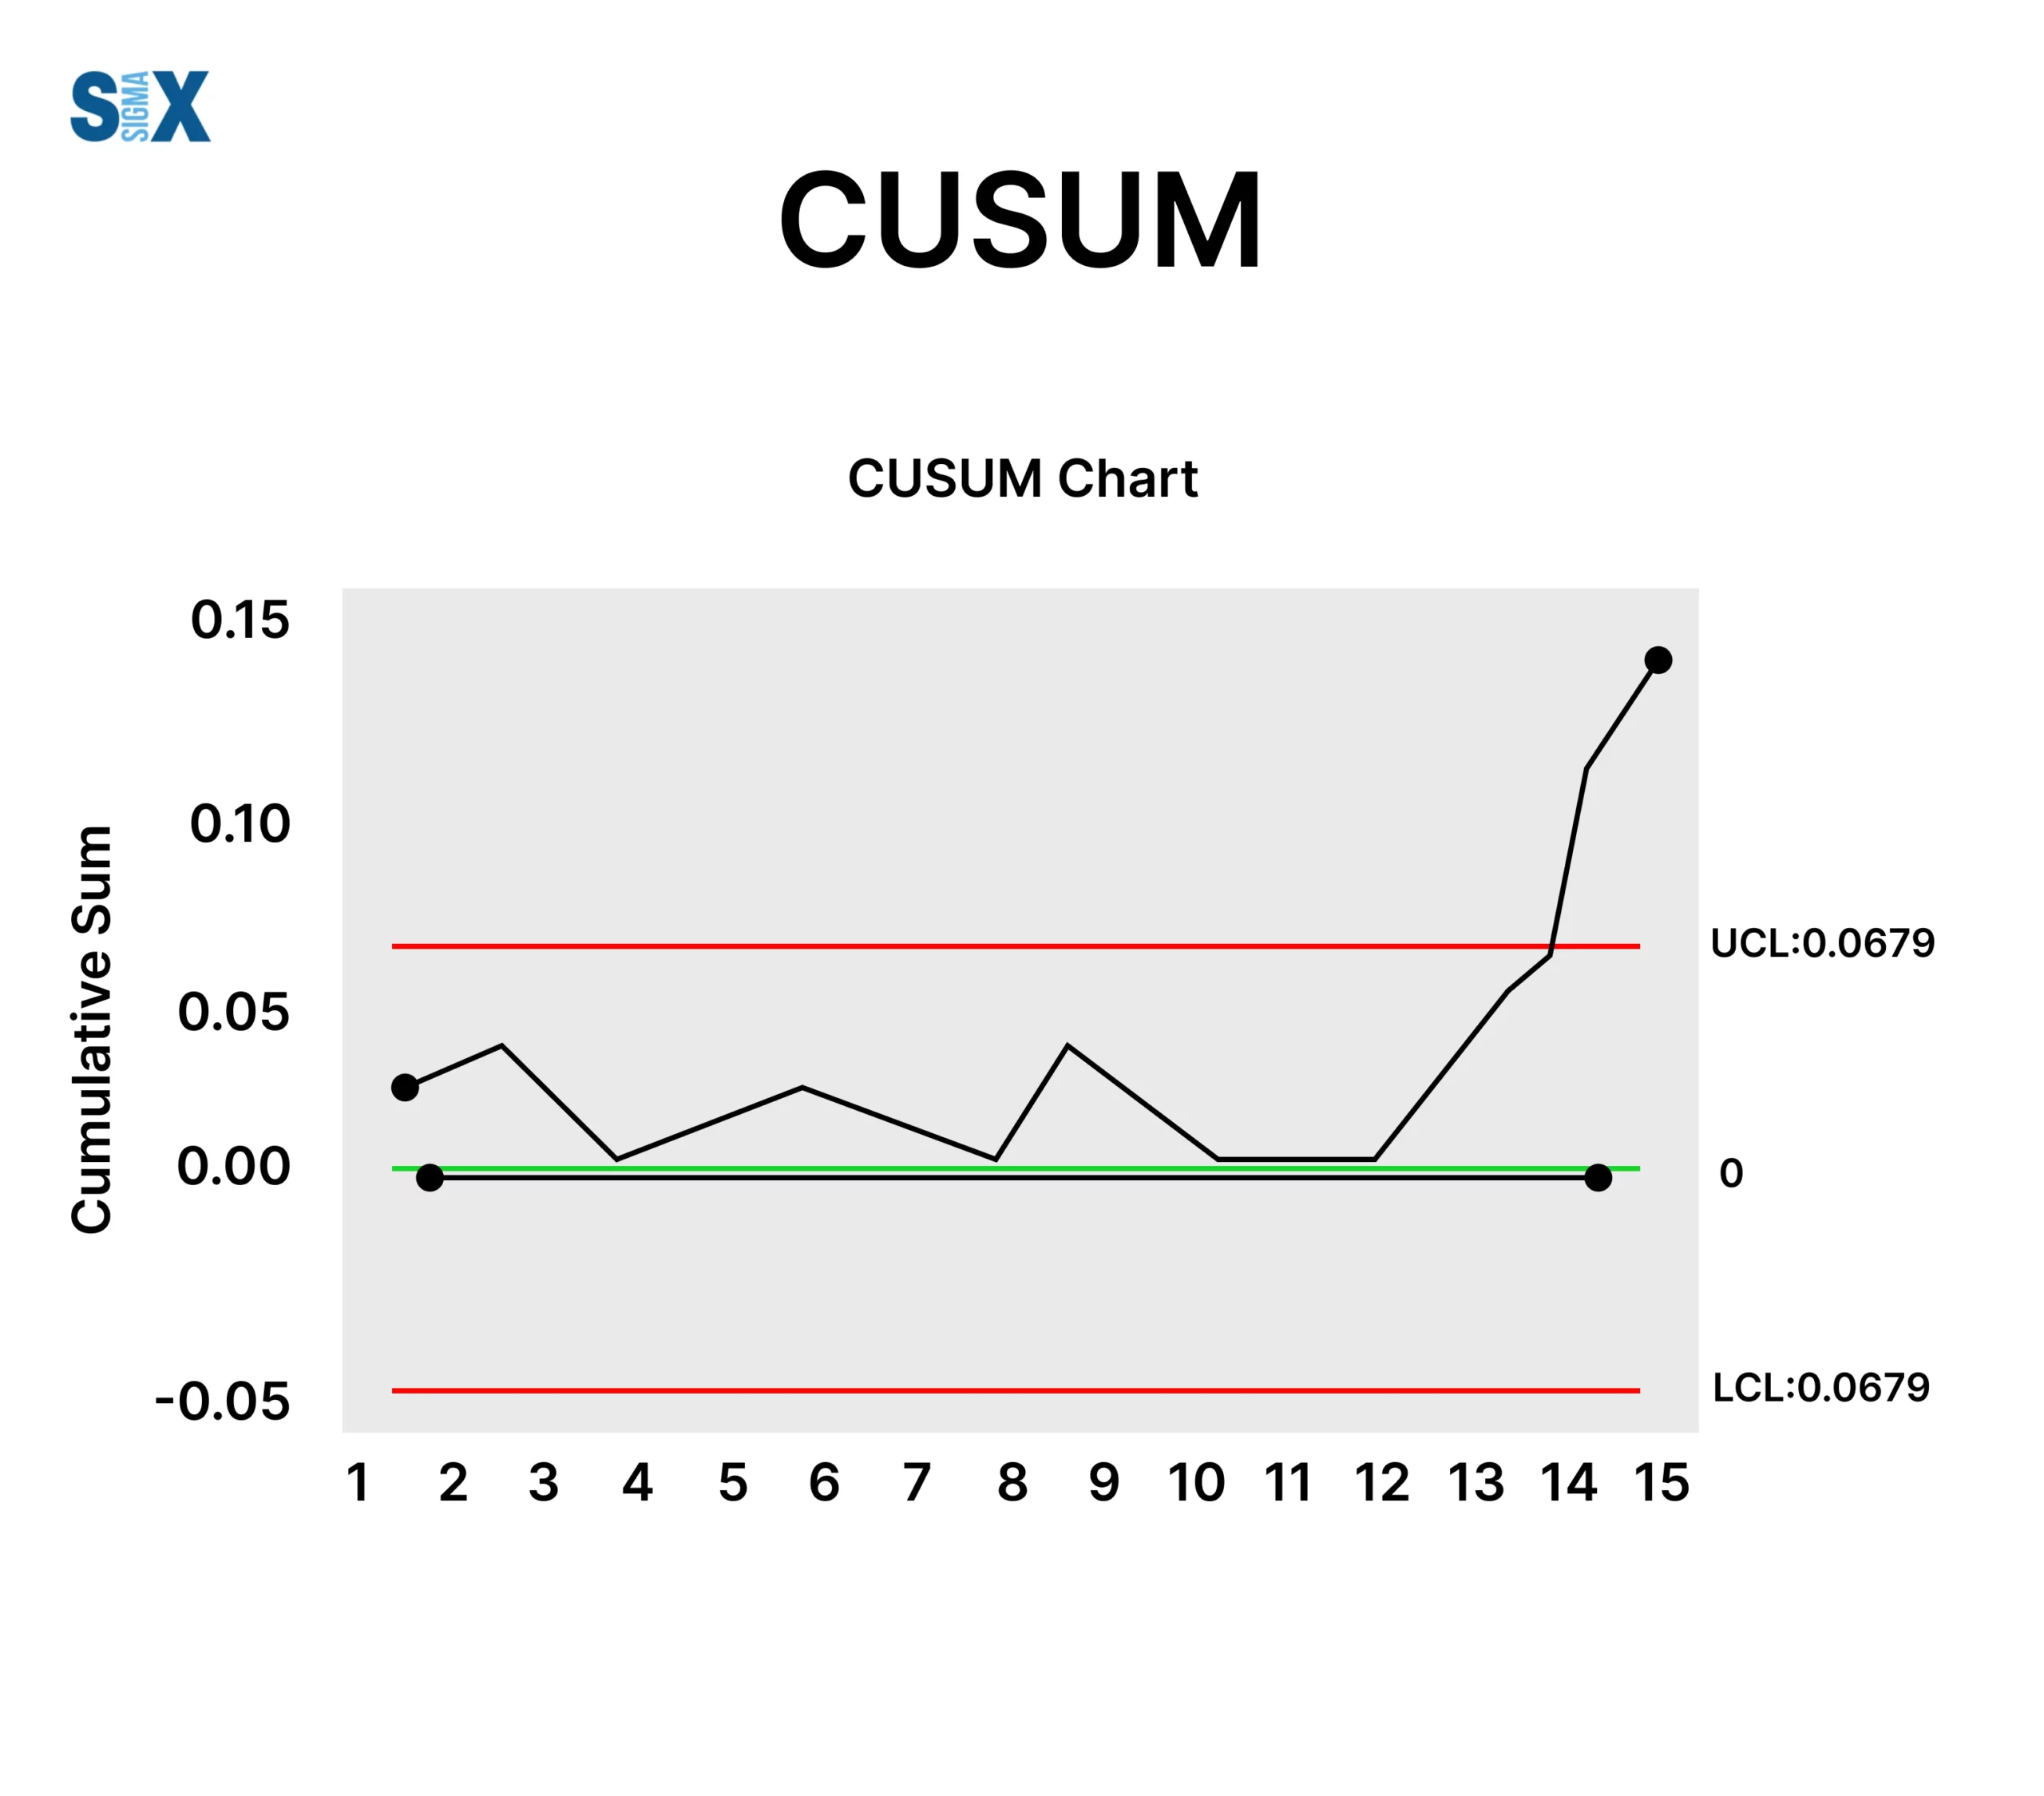
Unlike traditional control charts, where points outside the control limits indicate an out-of-control condition, CUSUM charts rely on monitoring the cumulative sums themselves. Specifically:
Out-of-control conditions: If the cumulative sum exceeds the decision interval (h), it signifies that the process has likely shifted and is now operating at a different mean level.
Identifying shift points: By backtracking the cumulative sum plot, it is possible to pinpoint the exact sample or observation where the process shift likely occurred, aiding in root cause analysis and corrective action planning.
Root cause analysis: The ability to identify shift points makes CUSUM charts invaluable for investigating and addressing the underlying causes of process instability, enabling targeted improvement efforts and preventing future occurrences.
CUSUM Charts in Practice
Their versatility and power have made them indispensable tools across a wide range of industries and applications, particularly in scenarios where small process shifts can have significant consequences.
From pharmaceutical manufacturing to chemical processes and quality control in various sectors, CUSUM charts have proven their mettle time and again.
Integrating CUSUM with Other SPC Tools
While CUSUM charts excel at detecting small process shifts, they may not be as effective at identifying larger deviations.
To address this limitation, many practitioners recommend integrating these charts with other statistical process control (SPC) tools, such as:
EWMA charts: Exponentially Weighted Moving Average (EWMA) charts, like CUSUM charts, are designed to detect small process shifts but employ a different weighting mechanism for past data points.
Shewhart charts: Combining CUSUM charts with traditional Shewhart charts can provide a comprehensive monitoring solution, leveraging the strengths of both approaches for detecting small and large process shifts.
Combined approaches: Some advanced monitoring strategies involve the simultaneous use of multiple control chart types, such as CUSUM, EWMA, and Shewhart charts, to maximize the likelihood of detecting any process abnormalities, regardless of their magnitude.
Implementing CUSUM Charts
As with any statistical tool, the successful implementation of CUSUM charts requires careful planning, training, and the right resources.
While the mathematical foundations may seem daunting, modern statistical software and spreadsheet applications have made their construction and interpretation more accessible than ever before.
Case Studies and Examples
To illustrate the practical application of CUSUM charts, let’s explore a few examples:
Pharmaceutical manufacturing: In the pharmaceutical industry, where even minor deviations from established parameters can have severe consequences, CUSUM charts are routinely employed to monitor critical quality attributes, such as active ingredient concentrations and tablet weights, ensuring compliance and patient safety.
Chemical processes: Process industries, like chemical manufacturing, often leverage these charts to monitor key process variables, such as temperatures, pressures, and flow rates, enabling timely adjustments and maintaining optimal operating conditions.
Quality control applications: From automotive parts inspection to semiconductor manufacturing, CUSUM charts have proven invaluable in various quality control applications, helping to identify and address potential issues before they escalate, minimizing waste, and ensuring consistent product quality.
Best Practices and Considerations
While CUSUM charts offer numerous advantages, their effective implementation requires careful consideration of several best practices and potential limitations.
By understanding and addressing these factors, organizations can maximize the benefits of CUSUM charts while mitigating potential risks and challenges.
Limitations and Alternatives
As powerful as these charts are, they do have some inherent limitations that should be acknowledged:
Large shift detection: While excelling at detecting small process shifts, CUSUM charts may not be as responsive to larger deviations in the process mean.
In such cases, traditional Shewhart charts or alternative control chart types may be more appropriate.
Non-normal distributions: CUSUM charts are designed with the assumption of normally distributed data.
For processes with non-normal distributions or skewed data, alternative control chart methods, such as those based on non-parametric techniques, may be more suitable.
Specialized control charts: In certain specialized applications or industries, more tailored control chart techniques may be required to address unique process characteristics or regulatory requirements.
Conclusion
CUSUM charts have proven instrumental in detecting and addressing subtle process performance shifts.
By tracking accumulated deviations from metric targets, these specialized charts provide unmatched sensitivity.
This allows organizations to maintain tight operations control and ensure consistent quality excellence.
As industries continually progress, CUSUM chart roles in monitoring will likely magnify.
The strong emphasis today on insights-driven decisions and constant upgrading highlights detecting even nuanced transformations’ importance for retaining competitiveness advantage.
The concept of these charts also synergize seamlessly with constant improvement philosophies, recognizing perfection as ongoing and room for progress always present.
By fully harnessing CUSUM analysis, enterprises foster proactive tracking, rapid responses, and relentless dedication to excellence in cultures.
Whether a quality veteran, engineer, or specialist, mastering CUSUM techniques empowers illuminating process comprehension to new heights. This activates significant improvements and contributions towards operational excellence pursuits within your organization.
SixSigma.us offers both Live Virtual classes as well as Online Self-Paced training. Most option includes access to the same great Master Black Belt instructors that teach our World Class in-person sessions. Sign-up today!
Virtual Classroom Training Programs Self-Paced Online Training Programs


