Create an Effective FAST (Function Analysis System Technique) Diagram
Continual optimization of outputs, provisions, and operations underpins commercial survival today. FAST Diagram(s) does just that.
FAST (Function Analysis System Technique) diagramming logically highlights what adds importance while pruning waste and lessness.
Emerging from value assessment, FAST mapping spreads widely – within lean, Six Sigma, and refinement projects.
Their talent parses convolutions into groundwork functions and logical mapping and structurally aids accessibility across sectors and scenes.
Diagramming grants wholehearted comprehension of target realizing or client service necessity functions.
This luminosity signs betterment chances, streamlined techniques, more economical workings, and heightened client importance conveyance.
Cooperation upgrades these capabilities serving altering requests. By shared responsibility and comprehension guiding changes, our strides light advantageous routes for availability, well-being, and success for all.
Key Highlights
- FAST (Function Analysis System Technique) diagramming presents a clear mapping approach used in value assessment, lean production, and refinement spheres.
- It logically diagrams output, service, or process core duties, upgrading comprehension. Deconstructing scopes into basic and progressive functions spotlights betterment chances.
- Benefits encompass enhanced engagement, superfluous task discovery, savings, and heightened client assistance.
- The technique proceeds systematically from framing topics and verbs to investigation and critical path charting. Cross-sector uses involve design, refinement, quality stewardship, project direction, and enterprise assessment.
- Diagramming tools streamline execution and cases showcase FAST’s practical benefits across industries. None progress alone – our joined efforts lift enterprises persistently serving to transform demands. Cooperation empowers prosperity sustainably through persistent cooperative betterment.
- Progress indeed arises from shared comprehension, as impediments ahead surface together solved. Our united strides uphold benefits for communities through technology and its prudent guidance.
What is a FAST Diagram?
FAST (Function Analysis System Technique) diagramming presents a useful mapping approach applied widely through value engineering, lean production, Six Sigma, and beyond.
It visually untangles functions of any output, service, or process to boost comprehension. FAST breaks scopes down hierarchically – basic functions constituting more involved functions collectively achieving the prime goal. This functional tree structure shows dependencies clearly.
Components include:
- Boundaries and subject-defined
- Top function sought
- Sequential actions needed
- “When/how” branches elaborating
- Relationships between become clear
By illuminating vital functions delivering client value, FAST diagrams flag optimization areas without such value.
Benefits of Using a FAST Diagram
Using a FAST (Function Analysis System Technique) diagram offers several key advantages in process improvement, product design, and business analysis initiatives. Some of the primary benefits include:
1. Promotes Function-Based Thinking
The FAST diagram technique encourages thinking in terms of functions rather than physical components or solutions. This function-based approach helps teams better understand the fundamental reasons behind a product or process, leading to more innovative improvements.
2. Improves Communication and Understanding
By breaking down a system into a visual mapping of functions, FAST diagrams provide a common language that enhances cross-functional communication and ensures everyone understands the true objectives and requirements.
3. Identifies Value-Adding and Non-Value-Adding Functions
FAST diagrams distinguish between basic functions that are essential to the system and secondary functions that may be redundant or non-value-adding. This visibility into value and non-value activities is crucial for eliminating waste and focusing efforts.
4. FAST Diagram Facilitates Root Cause Analysis
The hierarchical nature of FAST diagrams, which link higher-level functions to more detailed sub-functions, makes it easier to trace the root causes of problems or inefficiencies within a system.
5. Supports Structured Innovation
By separating functions from specific form solutions, FAST diagrams open up opportunities for teams to explore unconventional or creative ways to deliver the required functions more efficiently or cost-effectively.
6. FAST Diagram Enhances Cross-Functional Collaboration
Developing a FAST diagram often requires input from multiple departments or subject matter experts, promoting cross-functional collaboration and ensuring a comprehensive understanding of the system.
7. Applicable Across Industries and Domains
The versatility of the FAST diagramming technique allows it to be applied to a wide range of industries, products, processes, and types of systems, making it a valuable tool for diverse organizations.
How to Create a FAST Diagram
Creating a FAST diagram involves following a systematic process with defined steps. Here is how you can go about creating an effective FAST diagram:
1. Identify the Scope and Purpose
Start by clearly defining the scope of the analysis and the specific purpose or objective you want to achieve by creating the FAST diagram. This could be analyzing a product, process, service, or any other system.
2. Define the Subject or Function
Explain the subject or high-level function you will analyze using the FAST diagram. This becomes the critical path or spine of your diagram.
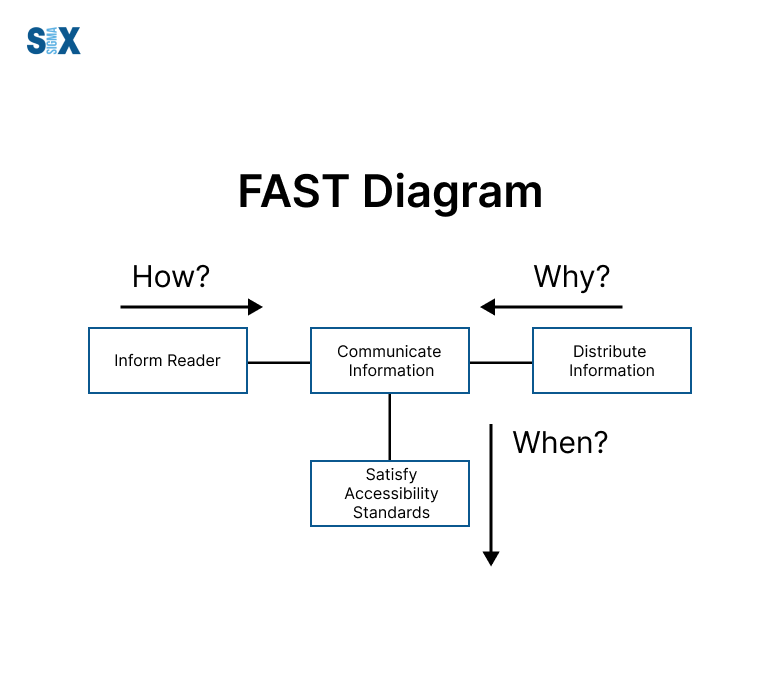
3. Ask the Question “How?”
With the defined subject/function, ask the “how” question to identify the functions that are required to accomplish it. These become the sub-functions that support the higher-level function, forming the next level of your diagram.
4. Ask the Question “Why?”
For each sub-function identified, ask “Why is this needed?” to determine the objective or purpose it serves. These become the higher-level functions that justify the existence of the sub-functions below them.
5. Build the FAST Diagram
Arrange all the identified functions into a logical hierarchy, connecting them with horizontal and vertical lines to represent the “how” and “why” relationships respectively. The critical path forms the spine or diagonal of the diagram.
6. Review and Refine the FAST Diagram
Carefully review the FAST diagram, checking for completeness, logic, and proper scope. Refine the diagram as needed, adding, removing, or rearranging functions until you are satisfied with the representation.
7. Analyze and Interpret
With the complete FAST diagram, you can now analyze it to identify areas for improvement, redundancies, cost drivers, or opportunities for innovation. The diagram provides a structured way to understand the relationships and importance of different functions.
8. Document and Communicate
Properly document the FAST diagram along with your analysis, insights, and recommendations. Communicate and share it with relevant stakeholders for review, discussion, and decision-making.
Applications of FAST Diagram
FAST diagrams have a wide range of applications across various industries and methodologies. Some of the primary areas where FAST diagrams are commonly used include:
Product Design and Development
FAST diagrams are extremely useful in the early stages of product design. They help product teams clearly define the functions a product needs to perform and establish the relationships between those functions.
This allows for better product planning, more focused design efforts, and the identification of unnecessary or missing functions.
Process Improvement with FAST Diagram
Whether manufacturing a product or delivering a service, FAST diagrams can reveal inefficiencies and non-value-added steps in a process.
By mapping out the functions required to deliver the fundamental objective, processes can be streamlined and optimized. FAST is a key tool in lean process improvement initiatives.
Value Engineering
FAST diagrams represent the core technique in the value engineering methodology. They allow cross-functional teams to analyze functions from the perspective of the value they provide to the customer.
This enables focusing resources on high-value functions and eliminating or minimizing low-value functions.
Requirements Analysis with FAST Diagram
When gathering requirements for a new system, software, or process, FAST diagrams ensure all necessary functions are identified upfront.
They provide a structured way to capture and organize requirements from multiple stakeholders. This application is common in systems engineering and business analysis.
Root Cause Analysis
By breaking down high-level functions into sub-functions, FAST diagrams facilitate getting to the root causes of problems or defects. They make it easier to isolate where core functions are not being properly performed or supported by sub-functions.
FAST Diagram in Different Methodologies
FAST diagrams are versatile tools that can be applied in various methodologies and disciplines. Here are some common applications of FAST diagrams across different fields:
Six Sigma
In Six Sigma, FAST diagrams are used during the Define phase to clearly understand the scope of a project or process.
They help identify the key functions that a product/service needs to perform to meet customer requirements. This lays a solid foundation for the subsequent Measure, Analyze, Improve, and Control phases.
Lean Management
Lean practitioners use FAST diagrams as part of value stream mapping exercises. By constructing a FAST diagram, teams can distinguish between truly value-adding functions versus non-value-adding functions.
This visibility allows them to eliminate waste and focus on optimizing the core value delivery.
FAST Diagram in Product/Service Design
FAST diagrams play a crucial role in product and service design by ensuring the design meets the essential functional requirements. They prevent over-engineering by focusing development efforts on the critical functions customers need and value.
FAST Diagram in Process Improvement
Whether using a structured methodology like Lean Six Sigma or general process improvement efforts, FAST diagrams provide clarity on what a process should fundamentally achieve.
This allows improvement teams to redesign processes effectively without losing sight of core objectives.
Value Engineering
Value engineering aims to maximize the value delivered relative to the cost involved. FAST diagrams are invaluable here as they objectively identify the most essential functions to prioritize value delivery and cost optimization efforts.
Requirements Engineering
In software/systems development, FAST diagrams bridge the gap between high-level business requirements and technical specifications. They translate customer needs into functional requirements that developers can implement.
Tools and Software for FAST Diagram
While FAST diagrams can be created using basic tools like pen and paper, there are various software options available that can make the process easier and more efficient. These tools allow you to quickly build, edit, and share FAST diagrams digitally.
Microsoft Visio
One of the most popular tools for creating diagrams and flowcharts is Microsoft Visio. It provides built-in templates and shapes specifically for FAST diagrams. Visio makes it easy to construct the hierarchical layout and connect shapes with relationship lines.
Lucidchart
Lucidchart is a web-based diagramming application that offers a user-friendly interface for building FAST diagrams.
It has a vast library of shapes and templates, including ones tailored for FAST. Lucidchart allows real-time collaboration, making it convenient for teams to work on diagrams together.
SmartDraw
SmartDraw is a diagramming solution that guides you through the process of creating a FAST diagram step-by-step.
It offers automatic formatting and layout options to ensure your diagram adheres to FAST conventions. SmartDraw integrates with popular office tools like Microsoft Office.
ConceptDraw
ConceptDraw is a diagramming and vector graphics application with robust FAST diagramming capabilities.
It includes stencil libraries with predesigned FAST shapes and templates. ConceptDraw supports exporting diagrams to multiple formats like PDF, HTML, and Microsoft Office.
Draw.io
Draw.io is a free, open-source diagramming web application that can be used to create FAST diagrams. While it doesn’t have built-in FAST templates, its flexibility allows you to construct diagrams from scratch using basic shapes and connectors.
In addition to dedicated diagramming tools, some project management and business process modeling software may also support creating FAST diagrams or offer plugins for this purpose.
When choosing a tool, consider factors like ease of use, collaboration features, integrations with other software you use, and whether it meets your specific FAST diagramming needs.
Case Studies and Examples
To better illustrate how FAST diagrams can be effectively applied, let’s look at some case studies and examples:
Example of Product Design with FAST Diagram
A manufacturer of outdoor grills wanted to improve their product line. They used a FAST diagram to analyze the essential functions their grills needed to perform like cooking food evenly, being easy to clean, having ample grilling space, etc. This allowed them to focus their redesign efforts on the core customer needs.
Process Improvement at a Call Center
A call center was having issues with long hold times and frustrated customers. They mapped out their current call process using a FAST diagram which revealed some non-value-added steps. They were able to streamline the process and reduce hold times.
Value Engineering for Construction Project with FAST Diagram
During the construction of a new office building, the project team used FAST diagrams to analyze the functional requirements at different stages. This allowed them to identify areas to reduce costs while still meeting necessary functions.
Six Sigma at a Bank
A bank applied Six Sigma methods to improve its account opening process. As part of the Define phase, they created a FAST diagram to understand the essential functions customers required when opening a new account. This provided clarity for making improvement efforts.
SixSigma.us offers both Live Virtual classes as well as Online Self-Paced training. Most option includes access to the same great Master Black Belt instructors that teach our World Class in-person sessions. Sign-up today!
Virtual Classroom Training Programs Self-Paced Online Training Programs


