Attribute Data: Unlocking Insights with Categorical Excellence
Really grasping different data types is crucial for making smart choices and refining workflows. One category that deserves more attention is attribute data.
Also called qualitative or discrete data, attribute data describes object, product or process traits. Unlike continuous info measured on scales, it is usually sorted into categories and counted.
Some examples include defect reports, customer survey responses using rating systems, and pass/fail outcomes from quality checks.
Mastering collecting, analyzing and deciphering it is hugely valuable for any professional, especially those working in quality control, workflow refinement and choices backed by numbers.
Understanding attribute data empowers organizations to gain insights on customer preferences. It also helps pinpoint places for optimization and improve product quality monitoring.
Key Highlights
- Understand the fundamental concept and how it differs from continuous data
- Explore the different types, including nominal, ordinal, and binary data
- Discover real-world examples and use cases across various industries
- Analyze the advantages and disadvantages
- Learn best practices for collecting, analyzing, and presenting it effectively
- Gain insights into advanced techniques like statistical process control and attribute gage studies
- Develop a comprehensive understanding of how it can drive business improvements
What is Attribute Data?
The importance of understanding the different types of data and their applications is crucial.
Attribute data is a critical yet often overlooked form that plays a crucial role in process improvement, quality control, and data-driven decision-making.
Defining Attribute Data
Attribute data, also known as qualitative or discrete data, is a type that describes the characteristics or attributes of an object, product, or process.
Unlike continuous data, which is measured on a scale and can take on any value within a range, it is categorized and counted. In simpler terms, attribute data represents the presence or absence of a specific characteristic or attribute.
Types of Attribute Data
There are several types of attribute data, each serving a different purpose and requiring specific analytical techniques.
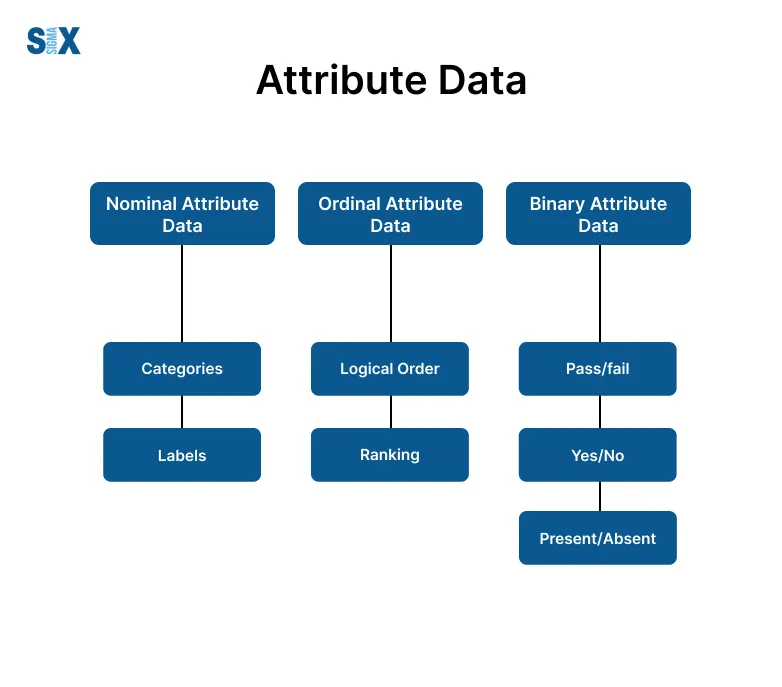
The main types include:
- Nominal Attribute Data: This type consists of categories or labels that have no inherent order or ranking. Examples include product colors, types of defects, or customer feedback categories.
- Ordinal Attribute Data: As the name suggests, it involves categories that have a logical order or ranking. Examples include customer satisfaction ratings (e.g., Very Dissatisfied, Dissatisfied, Neutral, Satisfied, Very Satisfied) or product quality grades (e.g., A, B, C, D, F).
- Binary Attribute Data: This is the simplest form, consisting of only two categories: pass/fail, yes/no, or present/absent. It is commonly used in quality control processes, where products are classified as either conforming or non-conforming.
Examples of Attribute Data in Action
Attribute data finds practical applications across various industries and processes.
Here are a few examples:
- Manufacturing Quality Control: Widely used in manufacturing to monitor product quality. Examples include counting the number of defective parts, classifying defects by type (e.g., scratches, dents, missing components), or assigning pass/fail grades based on visual inspections.
- Customer Surveys: Likert scales, which are commonly used in customer satisfaction surveys, are a form of ordinal attribute data. Responses are typically ranked from “Strongly Disagree” to “Strongly Agree,” providing valuable insights into customer sentiments and preferences.
- Medical Diagnoses: In the medical field, it is used to classify patients based on the presence or absence of certain symptoms or conditions. For example, a patient may be classified as having a particular disease or not (binary attribute data) based on diagnostic test results.
Importance and Applications of Attribute Data
While often overlooked in favor of continuous data, attribute data plays a crucial role in various industries and applications.
Its ability to provide categorical insights and support nonparametric analysis makes it a valuable tool for process improvement, quality control, and decision-making.
Benefits of Attribute Data
Working with attribute data offers several key benefits:
- Descriptive Analysis: It provides a clear and concise way to describe and categorize characteristics, making it easier to identify patterns, trends, and areas for improvement.
- Process Monitoring: By tracking it over time, organizations can monitor the stability and performance of their processes, enabling proactive identification and correction of issues.
- Customer Insights: Attribute data from customer surveys and feedback can provide valuable insights into customer preferences, pain points, and satisfaction levels, guiding product development and marketing strategies.
Use Cases Across Industries
Attribute data finds applications across a wide range of industries, including:
- Manufacturing: Quality control, defect tracking, and process capability studies.
- Healthcare: Diagnostic classifications, symptom tracking, and patient outcome monitoring.
- Services: Customer satisfaction surveys, complaint categorization, and service quality assessments.
- Marketing: Product attribute analysis, consumer segmentation, and preference studies.
- Finance: Risk classification, credit scoring, and fraud detection.
Advantages and Disadvantages of Attribute Data
Like any data type, this has its own set of advantages and disadvantages. Understanding these strengths and limitations is crucial for effective data collection, analysis, and interpretation.
Advantages
Some key advantages include:
Ease of Collection
It is often simpler to collect and record compared to continuous data, involving categorization or binary classifications.
Categorical Insights
It provides valuable insights into the presence or absence of specific characteristics, making it easier to identify patterns and trends.
Nonparametric Analysis
Many statistical techniques used for analysis, such as chi-square tests and contingency tables, do not require assumptions about the underlying data distribution, making them more flexible and robust.
Disadvantages
While attribute data offers many benefits, it also has some limitations:
Limited Precision
It lacks the precision and granularity of continuous data, as it involves categorization rather than precise measurements.
Sample Size Requirements
Due to its categorical nature, larger sample sizes are often required to obtain statistically significant results, especially for rarer categories or events.
Human Subjectivity
In some cases, attribute data collection may involve human judgment or perception, introducing the potential for bias or inconsistencies in classification.
Best Practices for Working with Attribute Data
As we have explored the fundamentals, its importance, and its advantages and disadvantages, it is crucial to understand and follow best practices when working with this type of data.
Proper planning, analysis, and presentation can significantly enhance its value and impact on process improvement and decision-making. In this section, we will delve into key best practices that every data-driven professional should embrace.
Data Collection Planning
Effective data collection is the foundation of any successful data analysis project. When it comes to attribute data, careful planning is essential to ensure data accuracy, consistency, and relevance. Here are some best practices for data collection planning:
Operational Definitions
Clearly define and document the attributes or characteristics you plan to measure. This includes establishing precise criteria for each category or classification and ensuring consistent interpretation by all data collectors.
Measurement Systems
Attribute data collection often involves human judgment or visual inspection. It is crucial to implement robust measurement systems, such as standardized rating scales, visual aids, or trained inspectors, to minimize subjective bias and ensure consistent data collection.
Sampling Techniques
Determine the appropriate sampling plan based on your objectives and resource constraints. It may require larger sample sizes to detect meaningful differences or patterns, especially for rare events or categories.
Data Analysis Methods
Once you have collected your attribute data, it’s time to analyze it using appropriate statistical techniques. Here are some commonly used methods for this:
Statistical Process Control (SPC)
SPC tools like control charts (e.g., p-charts, np-charts, c-charts, u-charts) are invaluable for monitoring and analyzing it over time, helping you detect and address process shifts or instability.
Graphical Analysis
Visual representations, such as Pareto charts, bar charts, and pie charts, can provide powerful insights into the distribution and relative importance of different attribute categories or defect types.
Attribute Gage Studies
In cases where this is collected through human inspection or judgment, attribute gage studies (also known as attribute agreement analysis) help assess the consistency and reliability of the measurement system by evaluating the agreement between inspectors or raters.
Data Presentation and Reporting
Effective communication of this analysis results is crucial for driving meaningful action and decision-making.
Here are some best practices for data presentation and reporting:
- Frequency Distributions: Present them using frequency distributions, which show the count or percentage of observations falling into each category or classification. This provides a clear overview of the data and facilitates comparisons.
- Pareto Charts: Pareto charts are powerful visual tools for highlighting the most significant categories or defect types based on their frequency or impact. They help prioritize improvement efforts by identifying the “vital few” areas that contribute most to the problem.
- Control Charts for Attributes: Control charts, such as p-charts, np-charts, c-charts, and u-charts, are essential for monitoring it over time and detecting process shifts or instability. They provide a visual representation of process performance and enable proactive identification of issues.
By adhering to these best practices for data collection planning, analysis, and presentation, you can maximize the value and impact within your organization.
Consistent and reliable attribute data analysis can provide valuable insights, drive process improvements, and support data-driven decision-making across various industries and applications.
Conclusion
Attribute data, despite its straightforwardness, packs a punch in any data-driven pro’s toolkit.
Grasping basics, types, and uses unlocks a valuable understanding of workflow accomplishment, product excellence, and customer needs.
While it has limits, perks like effortless collection, insights from categories, and nonparametric assessment make it important for choices backed by numbers.
Sticking to ideal practices for collecting, analyzing, and sharing info allows for maximizing attribute data’s power. It fuels impactful upgrades within your workplace.
In other words, don’t sleep on it just because it’s simple. With comprehension and smart handling, its categorical viewpoints can optimize processes sustainably from the inside out.
So in closing, embrace attribute data excellence. Combined with other data types, it arms your decisions for driving meaningful, lasting changes that deliver results.
SixSigma.us offers both Live Virtual classes as well as Online Self-Paced training. Most option includes access to the same great Master Black Belt instructors that teach our World Class in-person sessions. Sign-up today!
Virtual Classroom Training Programs Self-Paced Online Training Programs


